Bitcoin Breaks $66,000, But Analyst Warns Against Fresh Longs—Here’s Why
Bitcoin has shown bullish momentum during the past day, but an analyst has pointed out how the asset may be in a high-risk zone now due to the Open Interest trend. Bitcoin Open Interest Has Seen A Rapid Increase Recently As explained by CryptoQuant community manager Maartunn in a new post on X, the Bitcoin Open Interest has just surged to high levels. The “Open Interest” is an indicator that keeps track of the total amount of BTC-related positions currently open on all derivatives exchanges. Related Reading: Shiba Inu Rallies 34%, But Will FOMO End The Rally? When the value of this metric rises, it means the investors are opening up fresh positions on the derivatives market right now. As the overall leverage in the sector increases when this trend occurs, it can lead to higher asset price volatility. On the other hand, the indicator heading down suggests the derivatives contract holders are either closing up positions of their own volition or getting forcibly liquidated by their platform. This kind of trend can lead to more stability for BTC. Now, here is a chart that shows the trend in the Bitcoin Open Interest over the past year: As displayed in the above graph, the Bitcoin Open Interest had cooled off to relatively low levels earlier in the month as the asset’s price crashed. With the recovery in the coin, however, the indicator has been noting growth again. The indicator is now high, potentially implying the market has become overleveraged. As mentioned earlier, a high metric value can lead to more volatility for BTC. The reason behind this is that mass liquidation events can become more probable to occur at these levels, making the price act more volatile. On paper, the volatility emerging from an Open Interest increase can take the coin in either direction, but BTC has shown a consistent pattern in the past year. As the analyst has highlighted in the chart, the indicator entering into the same zone as now has generally turned out to be bearish for Bitcoin in this window. Related Reading: Render (RENDER) Shows 23% Surge As Sharks & Whales Continue To Buy In these instances, the Open Interest surge had occurred alongside price surges, indicating that long positions had been piling up. The latest growth in the indicator has also naturally come similarly. “We’re in a high-risk zone, and in my opinion, it’s not the best time for fresh long positions,” notes Maartunn. It remains to be seen how Bitcoin develops in the coming days and if it will hit the top, just like it did during those other instances. BTC Price Following the rally in the past day, Bitcoin has managed to find a break above the $66,000 level for the first time in almost two months Featured image from Dall-E, CryptoQuant.com, chart from TradingView.com

Bitcoin has shown bullish momentum during the past day, but an analyst has pointed out how the asset may be in a high-risk zone now due to the Open Interest trend.
Bitcoin Open Interest Has Seen A Rapid Increase Recently
As explained by CryptoQuant community manager Maartunn in a new post on X, the Bitcoin Open Interest has just surged to high levels. The “Open Interest” is an indicator that keeps track of the total amount of BTC-related positions currently open on all derivatives exchanges.
When the value of this metric rises, it means the investors are opening up fresh positions on the derivatives market right now. As the overall leverage in the sector increases when this trend occurs, it can lead to higher asset price volatility.
On the other hand, the indicator heading down suggests the derivatives contract holders are either closing up positions of their own volition or getting forcibly liquidated by their platform. This kind of trend can lead to more stability for BTC.
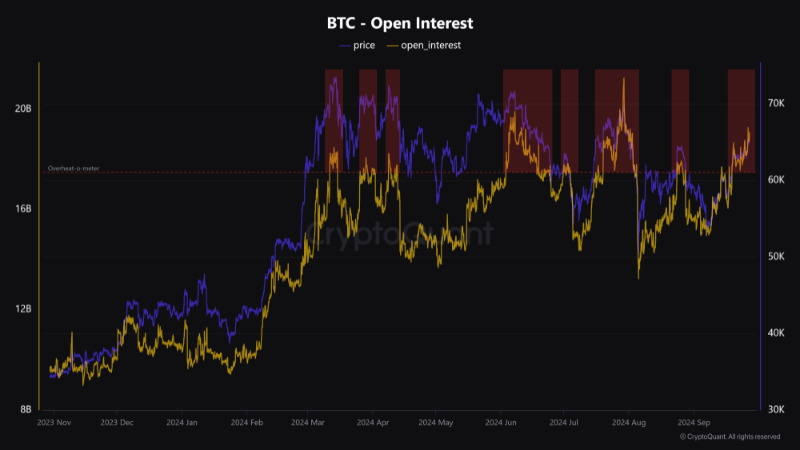
Now, here is a chart that shows the trend in the Bitcoin Open Interest over the past year:
As displayed in the above graph, the Bitcoin Open Interest had cooled off to relatively low levels earlier in the month as the asset’s price crashed. With the recovery in the coin, however, the indicator has been noting growth again.
The indicator is now high, potentially implying the market has become overleveraged. As mentioned earlier, a high metric value can lead to more volatility for BTC. The reason behind this is that mass liquidation events can become more probable to occur at these levels, making the price act more volatile.
On paper, the volatility emerging from an Open Interest increase can take the coin in either direction, but BTC has shown a consistent pattern in the past year. As the analyst has highlighted in the chart, the indicator entering into the same zone as now has generally turned out to be bearish for Bitcoin in this window.
In these instances, the Open Interest surge had occurred alongside price surges, indicating that long positions had been piling up. The latest growth in the indicator has also naturally come similarly.
“We’re in a high-risk zone, and in my opinion, it’s not the best time for fresh long positions,” notes Maartunn. It remains to be seen how Bitcoin develops in the coming days and if it will hit the top, just like it did during those other instances.
BTC Price
Following the rally in the past day, Bitcoin has managed to find a break above the $66,000 level for the first time in almost two months
What's Your Reaction?


