Bitcoin Could Top At $400,000 Based On This Model, Analyst Says
An analyst has explained how the next Bitcoin top could be situated around $400,000, if this model for the asset’s price continues to hold. Bitcoin Long-Term Power Law Could Reveal Possible Location Of Next Top In a new post on X, analyst Ali Martinez has talked about what the Long-Term Power Law could say about the next potential Bitcoin top. The “Long-Term Power Law” here refers to a BTC price model created by Bitbo. The model involves three lines, the main one being the “power law,” which is derived by taking a linear regression of the historical BTC price. “This power law is just a straight line to represent the correlation between Bitcoin’s price and time,” notes Bitbo in the model’s description. Related Reading: Bitcoin MVRV Ratio Is At A Critical Retest: Can Bulls Triumph? The other two lines of the model are just replicas of the power law, with the only difference being how they are arranged on the chart. One of these lines is placed under the power law just enough that BTC’s historical price either stays above it or touches it. This level of the model is called the support line. Similarly, the other line sets an upper boundary on the cryptocurrency’s price and is known as the resistance level. Now, here is a chart that shows the trend in the Bitcoin Long-Term Power Law over the history of the asset: As is visible in the graph, Bitcoin’s spot price is currently being traded under the power law. The asset retested the line earlier in the year when it set its new all-time high (ATH) but couldn’t find a break. Despite the recent bearish action, though, BTC still has some distance over the support line of the model. The graph shows that Bitcoin set three of its major tops around the resistance line. However, the 2021 bull run top occurred before the asset could reach the level. Thus, it’s unknown whether or not the current BTC cycle will follow the lead of the earlier three. Related Reading: Is Altcoin Season Coming? These Two Signals Could Suggest So “If the Bitcoin Long-Term Power Law holds, the next market top might hit around $400,000!” notes Martinez, based on the fact that the resistance level would assume a value around that mark next year. As for when exactly BTC could hit its next cyclical top, the analyst has also discussed it in another X post, sharing the chart below for the asset’s performance during the last couple of cycles. “If this Bitcoin cycle follows the last two, we could see a market top in about a year, around October 2025!” says Martinez. BTC Price Bitcoin has been moving sideways over the last few days as its price still floats around the $63,200 mark. Featured image from Dall-E, Glassnode.com, chart from TradingView.com

An analyst has explained how the next Bitcoin top could be situated around $400,000, if this model for the asset’s price continues to hold.
Bitcoin Long-Term Power Law Could Reveal Possible Location Of Next Top
In a new post on X, analyst Ali Martinez has talked about what the Long-Term Power Law could say about the next potential Bitcoin top. The “Long-Term Power Law” here refers to a BTC price model created by Bitbo.
The model involves three lines, the main one being the “power law,” which is derived by taking a linear regression of the historical BTC price. “This power law is just a straight line to represent the correlation between Bitcoin’s price and time,” notes Bitbo in the model’s description.
The other two lines of the model are just replicas of the power law, with the only difference being how they are arranged on the chart. One of these lines is placed under the power law just enough that BTC’s historical price either stays above it or touches it.
This level of the model is called the support line. Similarly, the other line sets an upper boundary on the cryptocurrency’s price and is known as the resistance level.
Now, here is a chart that shows the trend in the Bitcoin Long-Term Power Law over the history of the asset:
As is visible in the graph, Bitcoin’s spot price is currently being traded under the power law. The asset retested the line earlier in the year when it set its new all-time high (ATH) but couldn’t find a break. Despite the recent bearish action, though, BTC still has some distance over the support line of the model.
The graph shows that Bitcoin set three of its major tops around the resistance line. However, the 2021 bull run top occurred before the asset could reach the level. Thus, it’s unknown whether or not the current BTC cycle will follow the lead of the earlier three.
“If the Bitcoin Long-Term Power Law holds, the next market top might hit around $400,000!” notes Martinez, based on the fact that the resistance level would assume a value around that mark next year.
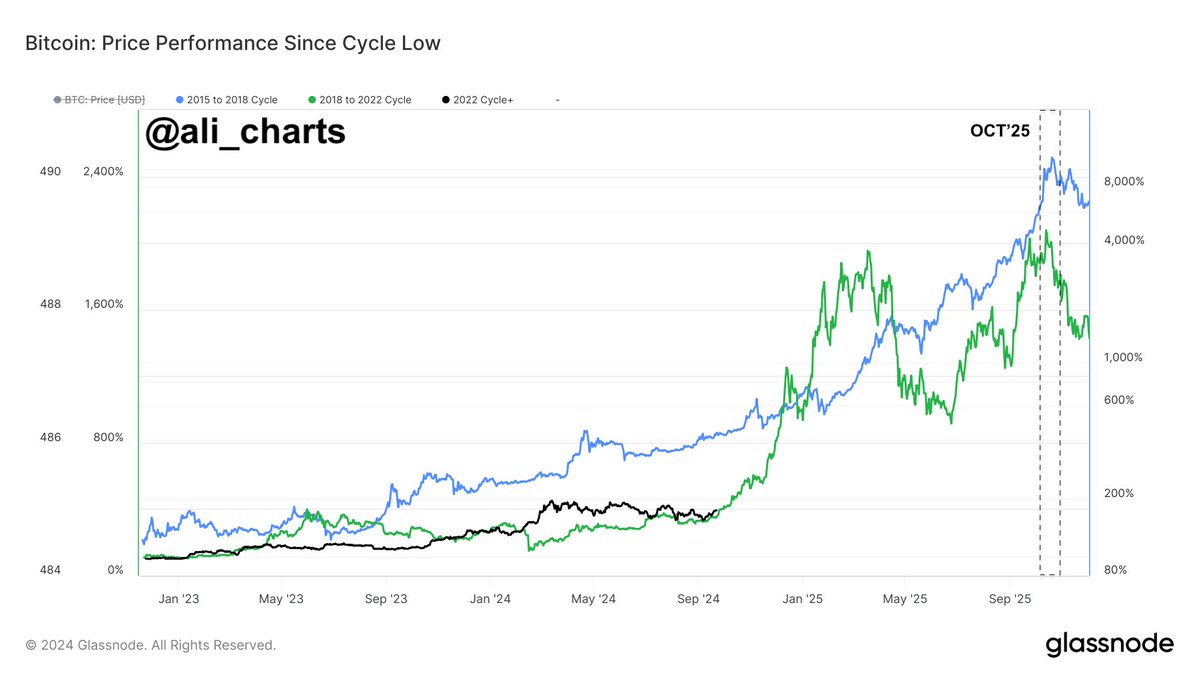
As for when exactly BTC could hit its next cyclical top, the analyst has also discussed it in another X post, sharing the chart below for the asset’s performance during the last couple of cycles.
“If this Bitcoin cycle follows the last two, we could see a market top in about a year, around October 2025!” says Martinez.
BTC Price
Bitcoin has been moving sideways over the last few days as its price still floats around the $63,200 mark.
What's Your Reaction?


