


Bitcoin Dead Cat Bounce? BTC Reclaims $57,000 But Analyst Not Convinced
Bitcoin prices cratered on July 4 before plunging some more a day later. However, by the close of Friday, the bar ended up with a long lower wick, with demand spilling over the weekend. As BTC prices stabilize, there may be hints that the downtrend is over, but not according to this analyst. Bitcoin Remains […]

Bitcoin prices cratered on July 4 before plunging some more a day later. However, by the close of Friday, the bar ended up with a long lower wick, with demand spilling over the weekend. As BTC prices stabilize, there may be hints that the downtrend is over, but not according to this analyst.
Bitcoin Remains Under Immense Selling Pressure: Here’s Why
Citing on-chain data, the analyst said the downtrend remains, and sellers have the upper hand. Pointing to the Bitcoin MVRV Momentum indicator, the trader noted that the reading is in negative territory for the first time in over 16 months.
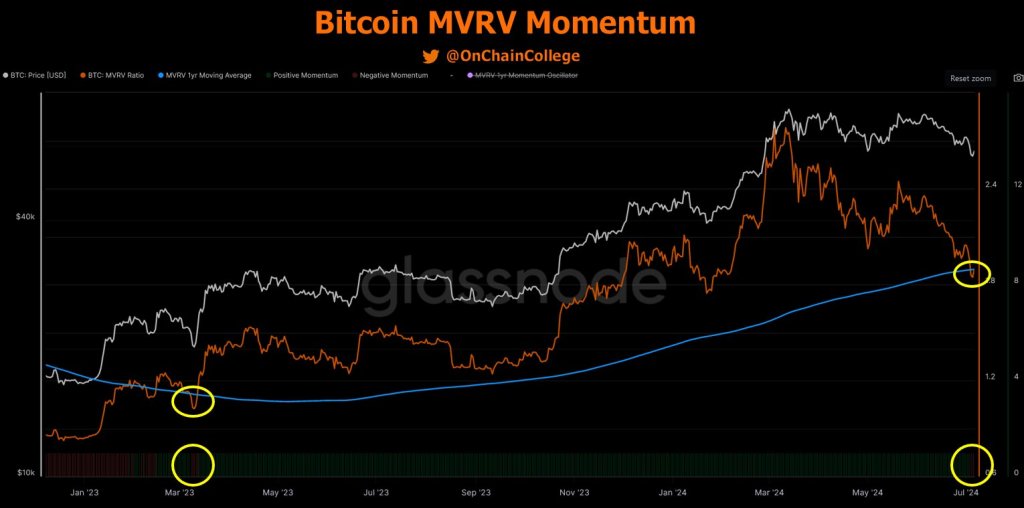
The last time this happened was in March 2023. Although prices recovered a few months after plateauing throughout early Q3 2023 before the lift-off in Q4 2024, whether the current formation will follow this script remains to be seen.
The Bitcoin MVRV Momentum indicator is a technical tool. It derives its data from on-chain readings, comparing the market value to the realized value of BTC. These two readings are often used to gauge overall market sentiment.
When the indicator trends above the 1-year moving average, Bitcoin prices tend to float higher. The chart shows that when prices were ripping higher, blasting above $70,000 to as high as $73,800, the indicator was firm above the moving average.
The indicator is below the moving average at press time, suggesting weakness across the board. If this trend continues, it may mean that the market is swinging bearish after overheating in the first half of the year.
Still, reading from the chart and especially considering the recovery in March 2023 when the same scenario was printed, investors are facing a dilemma. The indicator suggests market weakness, allowing buyers to double down.
At the same time, the breakout from the 12-month moving average could mean that bears are getting started, and more losses could be in the offing.
Should BTC Traders Be Patient?
The state of affairs means traders should be patient and check the market thoroughly. So far, when BTC prices plunged last week, they have become more attractive to sell, fanning the downward momentum.
This, in turn, presented an opportunity for buyers to buy back at a discount, forcing a short squeeze and liquidating leverage sellers in the process.
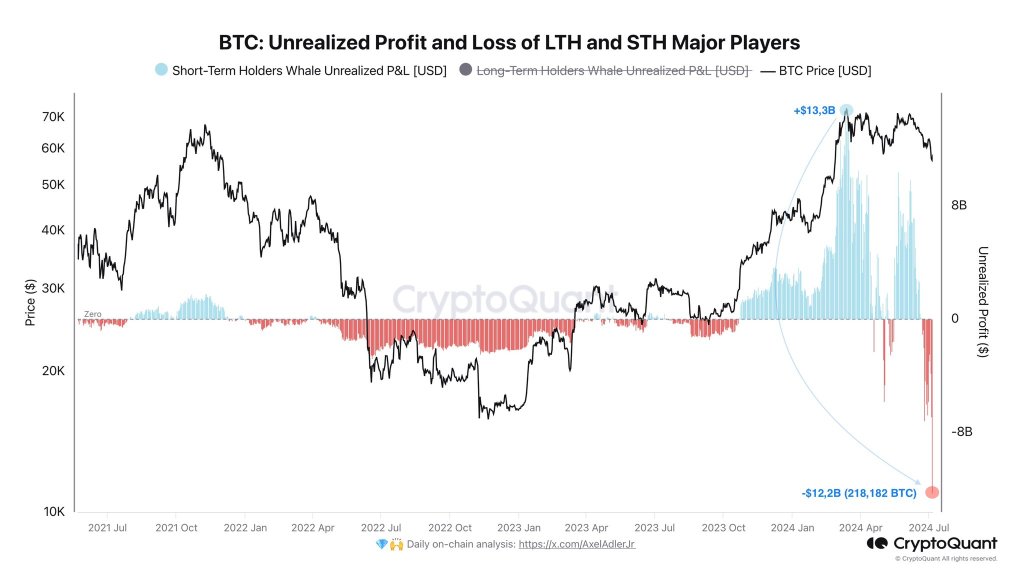
Whether leverage traders will capitulate and exit after gains in the last 48 hours remains to be known. Even so, one on-chain analyst notes that unrealized losses held by short-term holders (STHs) remain high. If prices drop and STHs panic by selling, it could trigger a rapid price collapse.
What's Your Reaction?


