


Bitcoin Price Reaches Rejection Zone: Can It Overcome the Resistance?
Bitcoin price recovered above the $62,000 resistance zone. BTC must clear the $62,500 resistance zone to continue higher in the near term. Bitcoin started a recovery wave above the $61,500 and $62,000 levels. The price is trading below $63,000 and the 100 hourly Simple moving average. There is a key bearish trend line forming with resistance at $62,500 on the hourly chart of the BTC/USD pair (data feed from Kraken). The pair might struggle to rise above the $62,500 and $63,000 resistance levels. Bitcoin Price Faces Resistance Bitcoin price extended losses below the $60,000 support zone. BTC even tested the $58,500 support zone, where the bulls emerged. A low was formed at $58,448 and the price is now correcting losses. There was a decent increase above the $60,000 level. The price climbed above the 50% Fib retracement level of the downward wave from the $64,460 swing high to the $58,448 low. It even moved above the $62,000 pivot level. However, Bitcoin price is still trading below $63,000 and the 100 hourly Simple moving average. The price seems to be facing a rejection zone near the $62,500 resistance, as discussed yesterday. There is also a key bearish trend line forming with resistance at $62,500 on the hourly chart of the BTC/USD pair. It is close to the 61.8% Fib retracement level of the downward wave from the $64,460 swing high to the $58,448 low. The next key resistance could be $63,000. A clear move above the $63,000 resistance might start a steady increase and send the price higher. In the stated case, the price could rise and test the $63,500 resistance. Any more gains might send BTC toward the $65,000 resistance in the near term. Another Decline In BTC? If Bitcoin fails to climb above the $62,500 resistance zone, it could start another decline. Immediate support on the downside is near the $60,500 level. The first major support is $60,000. The next support is now forming near $59,500. Any more losses might send the price toward the $58,500 support zone in the near term. Technical indicators: Hourly MACD – The MACD is now gaining pace in the bullish zone. Hourly RSI (Relative Strength Index) – The RSI for BTC/USD is now above the 50 level. Major Support Levels – $60,500, followed by $60,000. Major Resistance Levels – $62,500, and $63,000.

Bitcoin price recovered above the $62,000 resistance zone. BTC must clear the $62,500 resistance zone to continue higher in the near term.
- Bitcoin started a recovery wave above the $61,500 and $62,000 levels.
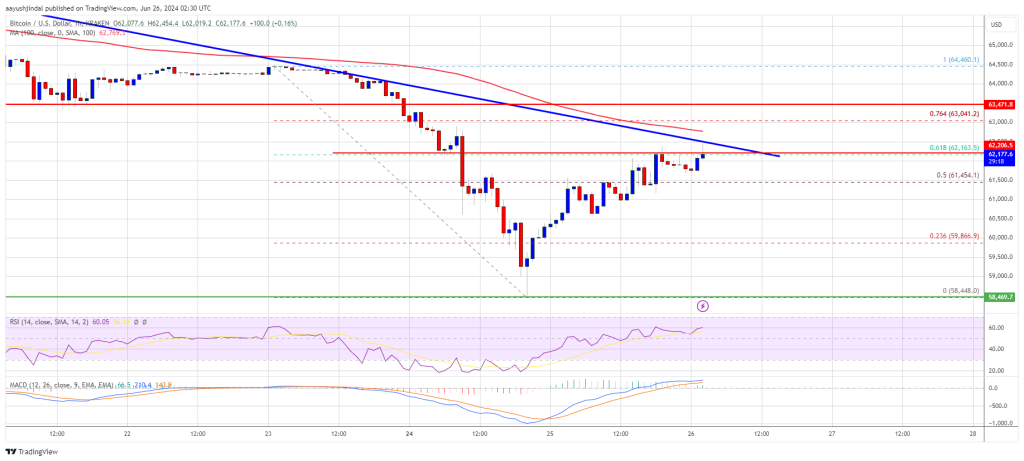
- The price is trading below $63,000 and the 100 hourly Simple moving average.
- There is a key bearish trend line forming with resistance at $62,500 on the hourly chart of the BTC/USD pair (data feed from Kraken).
- The pair might struggle to rise above the $62,500 and $63,000 resistance levels.
Bitcoin Price Faces Resistance
Bitcoin price extended losses below the $60,000 support zone. BTC even tested the $58,500 support zone, where the bulls emerged. A low was formed at $58,448 and the price is now correcting losses. There was a decent increase above the $60,000 level.
The price climbed above the 50% Fib retracement level of the downward wave from the $64,460 swing high to the $58,448 low. It even moved above the $62,000 pivot level. However, Bitcoin price is still trading below $63,000 and the 100 hourly Simple moving average.
The price seems to be facing a rejection zone near the $62,500 resistance, as discussed yesterday. There is also a key bearish trend line forming with resistance at $62,500 on the hourly chart of the BTC/USD pair. It is close to the 61.8% Fib retracement level of the downward wave from the $64,460 swing high to the $58,448 low.
The next key resistance could be $63,000. A clear move above the $63,000 resistance might start a steady increase and send the price higher. In the stated case, the price could rise and test the $63,500 resistance. Any more gains might send BTC toward the $65,000 resistance in the near term.
Another Decline In BTC?
If Bitcoin fails to climb above the $62,500 resistance zone, it could start another decline. Immediate support on the downside is near the $60,500 level.
The first major support is $60,000. The next support is now forming near $59,500. Any more losses might send the price toward the $58,500 support zone in the near term.
Technical indicators:
Hourly MACD – The MACD is now gaining pace in the bullish zone.
Hourly RSI (Relative Strength Index) – The RSI for BTC/USD is now above the 50 level.
Major Support Levels – $60,500, followed by $60,000.
Major Resistance Levels – $62,500, and $63,000.
What's Your Reaction?