Bitcoin Price Signals Bullish Continuation With SuperTrend Rising, Here’s The Next Target After Beating $81,000
The Bitcoin price trajectory has been nothing short of impressive since the beginning of November. Notably, Bitcoin has been up by about 20.8% from its November low of $67,690, which has allowed it to break into new all-time highs successively. Interestingly, technical analysis of the Bitcoin price suggests this uptrend isn’t stopping soon, and Bitcoin holders can continue to expect gains as the year draws to a close. According to crypto analyst Tony “The Bull” Severino, CMT, the SuperTrend indicator is now pointing to a bullish continuation for the Bitcoin price. What’s more intriguing is the fact that this marks the first time the indicator is rising after 34 weeks of sideways movement. SuperTrend Indicator Points To Bullish Continuation Crypto analyst Tony “The Bull” Severino has added further weight to this positive outlook surrounding the Bitcoin price. According to his analysis, the recent bullish price action has seen the SuperTrend indicator, an indicator often used to gauge market direction, trending upwards for Bitcoin on the weekly timeframe. Interestingly, technical analysis of the Bitcoin price chart on the weekly candlestick timeframe shows that the SuperTrend indicator had been moving horizontally since March 2024 up until recently. Throughout this period, the indicator held steady despite volatility, even during Bitcoin’s downward spike in August, when Bitcoin dipped to $49,600. Even then, Bitcoin managed to recover, finding support on the weekly SuperTrend line. Next Target For The Bitcoin Price Recent market dynamics have seen the Bitcoin price reeling in bullish sentiment. To put this in context, the Bitcoin price has been trading within a range of $78,649 to $81,800 in the past 24 hours, with a trading volume of $83.7 billion, according to CoinGecko. As such, Bitcoin now has an all-time high of $81,800 at the time of writing, although it has corrected a bit and is currently trading at $80,965. Now, with the SuperTrend indicator turning upward, there is a renewed sense of optimism for Bitcoin’s price trajectory. As noted by Tony Severino in another post on social media platform X, the recent uptrend has seen Bitcoin kicking off a new upside move within an uptrend channel that has been in formation since October 2023. Interestingly, the first guaranteed target in light of this upside move is in the middle of the uptrend channel, which Severino highlighted to be $100,000. With Bitcoin currently trading at around $81,000, this target represents a further increase of about 23.5%. However, if the Bitcoin were to reach the upper trendline of this uptrend channel, it would see it reaching the $170,000 price threshold, which would represent a 110% increase from the current price. Featured image created with Dall.E, chart from Tradingview.com

The Bitcoin price trajectory has been nothing short of impressive since the beginning of November. Notably, Bitcoin has been up by about 20.8% from its November low of $67,690, which has allowed it to break into new all-time highs successively. Interestingly, technical analysis of the Bitcoin price suggests this uptrend isn’t stopping soon, and Bitcoin holders can continue to expect gains as the year draws to a close.
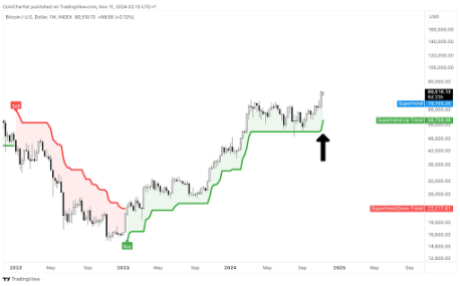
According to crypto analyst Tony “The Bull” Severino, CMT, the SuperTrend indicator is now pointing to a bullish continuation for the Bitcoin price. What’s more intriguing is the fact that this marks the first time the indicator is rising after 34 weeks of sideways movement.
SuperTrend Indicator Points To Bullish Continuation
Crypto analyst Tony “The Bull” Severino has added further weight to this positive outlook surrounding the Bitcoin price. According to his analysis, the recent bullish price action has seen the SuperTrend indicator, an indicator often used to gauge market direction, trending upwards for Bitcoin on the weekly timeframe.
Interestingly, technical analysis of the Bitcoin price chart on the weekly candlestick timeframe shows that the SuperTrend indicator had been moving horizontally since March 2024 up until recently. Throughout this period, the indicator held steady despite volatility, even during Bitcoin’s downward spike in August, when Bitcoin dipped to $49,600. Even then, Bitcoin managed to recover, finding support on the weekly SuperTrend line.

Next Target For The Bitcoin Price
Recent market dynamics have seen the Bitcoin price reeling in bullish sentiment. To put this in context, the Bitcoin price has been trading within a range of $78,649 to $81,800 in the past 24 hours, with a trading volume of $83.7 billion, according to CoinGecko. As such, Bitcoin now has an all-time high of $81,800 at the time of writing, although it has corrected a bit and is currently trading at $80,965.
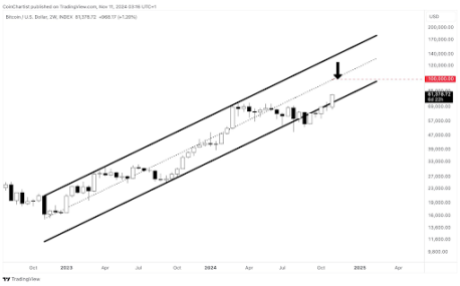
Now, with the SuperTrend indicator turning upward, there is a renewed sense of optimism for Bitcoin’s price trajectory. As noted by Tony Severino in another post on social media platform X, the recent uptrend has seen Bitcoin kicking off a new upside move within an uptrend channel that has been in formation since October 2023.
Interestingly, the first guaranteed target in light of this upside move is in the middle of the uptrend channel, which Severino highlighted to be $100,000. With Bitcoin currently trading at around $81,000, this target represents a further increase of about 23.5%.

However, if the Bitcoin were to reach the upper trendline of this uptrend channel, it would see it reaching the $170,000 price threshold, which would represent a 110% increase from the current price.
What's Your Reaction?


