BNB Eyes $605 After Breaking Key Resistance: Can The Bulls Maintain Momentum?
BNB has demonstrated significant bullish momentum, with a positive candlestick crossing the 100-day Simple Moving Average (SMA) in the 4-hour timeframe. The previous market scenario reveals that the digital currency has faced multiple rejections at the $572 level. This persistent resistance has cleared a path for the bulls to take charge and drive the price higher aiming at the $605 resistance level. As market dynamics shift, the key question is whether BNB can continue its current upward trend and hit the new target of $605. In this article, we will analyze the recent price movements of BNB using technical indicators to determine whether the price can sustain its momentum to reach $605 or decline back to $572. Technical Analysis Indicates Potential Rise To $605 Technical analysis reveals that the price of BNB has successfully crossed above the 100-day Simple Moving Average (SMA) on the 4-hour chart, indicating a potential bullish trend and increased buying momentum. This position indicates that BNB’s price could continue rising as long as it remains above the SMA. On the 4-hour chart, the Relative Strength Index (RSI) signal line has successfully risen above 50% into the overbought zone, signaling a potential shift in momentum, which suggests that buying pressure is increasing and the asset might experience further upward movement towards the $605.6 level. Meanwhile, on the daily chart of BNB, the price is attempting to break above the 100-day SMA. A successful cross above this key technical level could signal potential bullish momentum. If BNB maintains its position above the 100-day SMA, it might trigger a sustained uptrend and greater investor confidence. Also, the RSI indicator is trading above 50%, further supporting the possibility of a bullish trend, indicating that buying pressure is currently stronger than selling pressure. BNB’s 1-day chart shows that a bullish engulfing candlestick has formed following the rejection at $572. This pattern demonstrates a potential trend reversal and could make the $605 target achievable. Key Levels To Observe When BNB Reaches $605 Resistance BNB is on a bullish trajectory, targeting the $605 resistance level. If the price of BNB breaks and closes above the $605 level, it may continue its rally toward the next resistance level at $635 and possibly other levels beyond. Nonetheless, should the digital asset face rejection at $605 and fail to break above it, a potential downward move could follow, possibly retreating to $572. The $572 level could act as a key support zone, where the price may stabilize or consolidate. However, if $572 fails to hold, a deeper correction could occur to lower support ranges such as $553.3 and $500. As of the time of writing, BNB’s price has risen by 2.09%, trading at approximately $585 in the past 24 hours. The cryptocurrency boasts a market capitalization exceeding $85 billion and a trading volume surpassing $1.8 billion, indicating an increase of 2.09% and 3.57% respectively over the same period. Featured image from Adobe Stock, chart from Tradingview.com

BNB has demonstrated significant bullish momentum, with a positive candlestick crossing the 100-day Simple Moving Average (SMA) in the 4-hour timeframe. The previous market scenario reveals that the digital currency has faced multiple rejections at the $572 level.
This persistent resistance has cleared a path for the bulls to take charge and drive the price higher aiming at the $605 resistance level. As market dynamics shift, the key question is whether BNB can continue its current upward trend and hit the new target of $605.
In this article, we will analyze the recent price movements of BNB using technical indicators to determine whether the price can sustain its momentum to reach $605 or decline back to $572.
Technical Analysis Indicates Potential Rise To $605
Technical analysis reveals that the price of BNB has successfully crossed above the 100-day Simple Moving Average (SMA) on the 4-hour chart, indicating a potential bullish trend and increased buying momentum. This position indicates that BNB’s price could continue rising as long as it remains above the SMA.
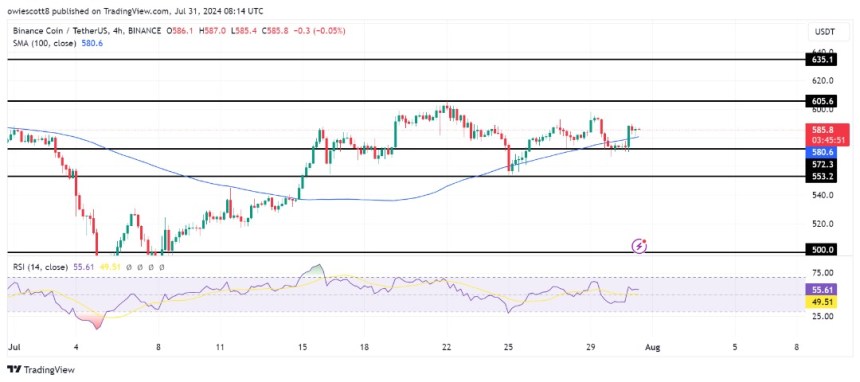
On the 4-hour chart, the Relative Strength Index (RSI) signal line has successfully risen above 50% into the overbought zone, signaling a potential shift in momentum, which suggests that buying pressure is increasing and the asset might experience further upward movement towards the $605.6 level.
Meanwhile, on the daily chart of BNB, the price is attempting to break above the 100-day SMA. A successful cross above this key technical level could signal potential bullish momentum. If BNB maintains its position above the 100-day SMA, it might trigger a sustained uptrend and greater investor confidence.
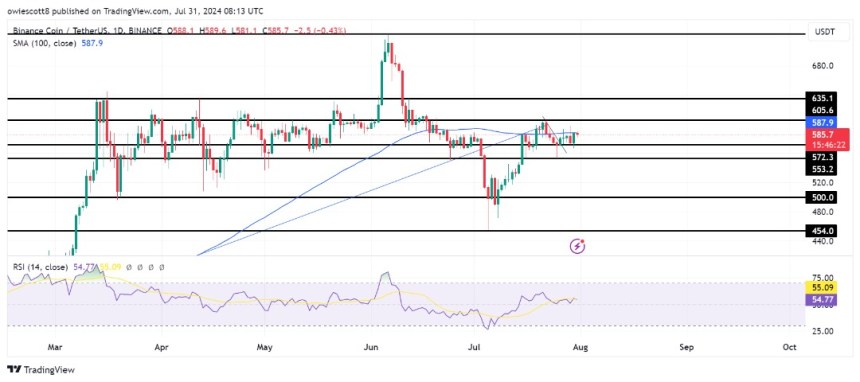
Also, the RSI indicator is trading above 50%, further supporting the possibility of a bullish trend, indicating that buying pressure is currently stronger than selling pressure. BNB’s 1-day chart shows that a bullish engulfing candlestick has formed following the rejection at $572. This pattern demonstrates a potential trend reversal and could make the $605 target achievable.
Key Levels To Observe When BNB Reaches $605 Resistance
BNB is on a bullish trajectory, targeting the $605 resistance level. If the price of BNB breaks and closes above the $605 level, it may continue its rally toward the next resistance level at $635 and possibly other levels beyond.
Nonetheless, should the digital asset face rejection at $605 and fail to break above it, a potential downward move could follow, possibly retreating to $572. The $572 level could act as a key support zone, where the price may stabilize or consolidate. However, if $572 fails to hold, a deeper correction could occur to lower support ranges such as $553.3 and $500.
As of the time of writing, BNB’s price has risen by 2.09%, trading at approximately $585 in the past 24 hours. The cryptocurrency boasts a market capitalization exceeding $85 billion and a trading volume surpassing $1.8 billion, indicating an increase of 2.09% and 3.57% respectively over the same period.
What's Your Reaction?