
BNB Price Plummets Below $500: Bears Eye $420 With 20% Decline
BNB price started a major decline and dived below the $500 support. The price is now gaining bearish momentum and might even test $420. BNB price started a major decline below the $550 support zone. The price is now trading below $500 and the 100-hourly simple moving average. There is a connecting bearish trend line forming with resistance at $495 on the hourly chart of the BNB/USD pair (data source from Binance). The pair could extend losses and even test the $420 support in the near term. BNB Price Dives 20% In the past few days, BNB price saw a steady decline from the $580 resistance, like Ethereum and Bitcoin. In the past 2-3 sessions, the bears took control and pushed the price below the $500 support zone. The price is down 20% and it even spiked below the $475 support. A low was formed at $466.1 and the price is now showing a lot of bearish signs. There are hardly any signs of a recovery wave, and the price is well below the 23.6% Fib retracement level of the downward move from the $580 swing high to the $466 low. The price is now trading below $500 and the 100-hourly simple moving average. If there is a recovery wave, the price could face resistance near the $485 level. The next resistance sits near the $492 level. There is also a connecting bearish trend line forming with resistance at $495 on the hourly chart of the BNB/USD pair. A clear move above the $495 zone could send the price higher. In the stated case, BNB price could test $520 or the 50% Fib retracement level of the downward move from the $580 swing high to the $466 low. A close above the $520 resistance might set the pace for a larger increase toward the $535 resistance. Any more gains might call for a test of the $550 level in the coming days. More Losses? If BNB fails to clear the $492 resistance, it could continue to move down. Initial support on the downside is near the $465 level. The next major support is near the $455 level. The main support sits at $450. If there is a downside break below the $450 support, the price could drop toward the $432 support. Any more losses could initiate a larger decline toward the $420 level. Technical Indicators Hourly MACD – The MACD for BNB/USD is gaining pace in the bearish zone. Hourly RSI (Relative Strength Index) – The RSI for BNB/USD is currently below the 25 level. Major Support Levels – $465 and $450. Major Resistance Levels – $485 and $492.

BNB price started a major decline and dived below the $500 support. The price is now gaining bearish momentum and might even test $420.
- BNB price started a major decline below the $550 support zone.
- The price is now trading below $500 and the 100-hourly simple moving average.
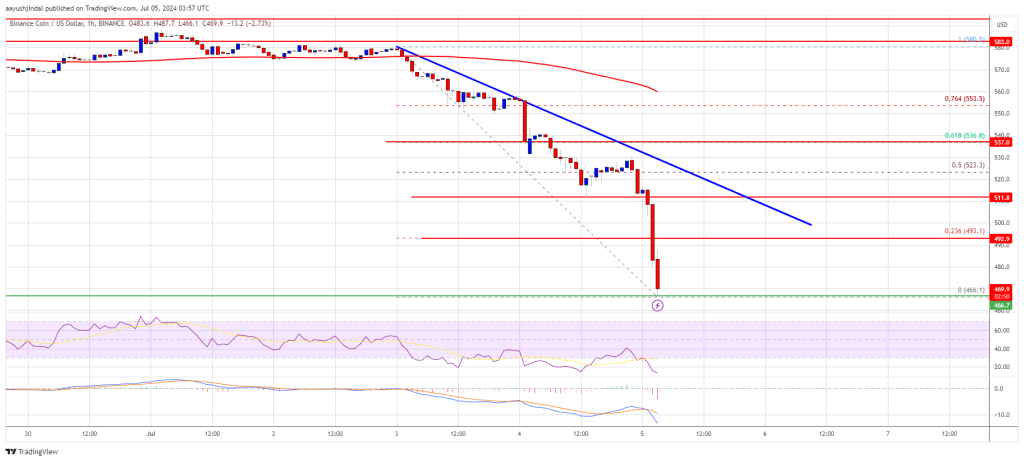
- There is a connecting bearish trend line forming with resistance at $495 on the hourly chart of the BNB/USD pair (data source from Binance).
- The pair could extend losses and even test the $420 support in the near term.
BNB Price Dives 20%
In the past few days, BNB price saw a steady decline from the $580 resistance, like Ethereum and Bitcoin. In the past 2-3 sessions, the bears took control and pushed the price below the $500 support zone.
The price is down 20% and it even spiked below the $475 support. A low was formed at $466.1 and the price is now showing a lot of bearish signs. There are hardly any signs of a recovery wave, and the price is well below the 23.6% Fib retracement level of the downward move from the $580 swing high to the $466 low.
The price is now trading below $500 and the 100-hourly simple moving average. If there is a recovery wave, the price could face resistance near the $485 level. The next resistance sits near the $492 level. There is also a connecting bearish trend line forming with resistance at $495 on the hourly chart of the BNB/USD pair.
A clear move above the $495 zone could send the price higher. In the stated case, BNB price could test $520 or the 50% Fib retracement level of the downward move from the $580 swing high to the $466 low.
A close above the $520 resistance might set the pace for a larger increase toward the $535 resistance. Any more gains might call for a test of the $550 level in the coming days.
More Losses?
If BNB fails to clear the $492 resistance, it could continue to move down. Initial support on the downside is near the $465 level.
The next major support is near the $455 level. The main support sits at $450. If there is a downside break below the $450 support, the price could drop toward the $432 support. Any more losses could initiate a larger decline toward the $420 level.
Technical Indicators
Hourly MACD – The MACD for BNB/USD is gaining pace in the bearish zone.
Hourly RSI (Relative Strength Index) – The RSI for BNB/USD is currently below the 25 level.
Major Support Levels – $465 and $450.
Major Resistance Levels – $485 and $492.
What's Your Reaction?