


BNB Price Targeting $600: Can It Reclaim This Milestone?
BNB price is holding the $565 support zone. The price is now consolidating and might aim for more gains above $590 in the near term. BNB price started a decent upward move from the $565 support zone. The price is now trading above $580 and the 100-hourly simple moving average. There was a break above a key bearish trend line with resistance at $582 on the hourly chart of the BNB/USD pair (data source from Binance). The pair could extend its increase if it clears the $590 resistance in the near term. BNB Price Eyes More Upsides In the past few days, BNB price saw a decent upward move from the $565 support zone, like Ethereum and Bitcoin. The price was able to climb above the $572 and $580 resistance levels. It even cleared the $582 resistance. The current wave surpassed the 50% Fib retracement level of the downward move from the $597 swing high to the $568 low. Besides, there was a break above a key bearish trend line with resistance at $582 on the hourly chart of the BNB/USD pair. The price is now trading above $582 and the 100-hourly simple moving average. It is now consolidating near the 61.8% Fib retracement level of the downward move from the $597 swing high to the $568 low. On the upside, the price could face resistance near the $588 level. The next resistance sits near the $590 level. A clear move above the $590 zone could send the price higher. In the stated case, BNB price could test $600. A close above the $600 resistance might set the pace for a larger increase toward the $620 resistance. Any more gains might call for a test of the $632 level in the near term. Are Dips Limited? If BNB fails to clear the $590 resistance, it could start a downside correction. Initial support on the downside is near the $582 level or the 100-hourly simple moving average. The next major support is near the $575 level. The main support sits at $565. If there is a downside break below the $565 support, the price could drop toward the $550 support. Any more losses could initiate a larger decline toward the $532 level. Technical Indicators Hourly MACD – The MACD for BNB/USD is gaining pace in the bullish zone. Hourly RSI (Relative Strength Index) – The RSI for BNB/USD is currently above the 50 level. Major Support Levels – $582 and $575. Major Resistance Levels – $590 and $600.

BNB price is holding the $565 support zone. The price is now consolidating and might aim for more gains above $590 in the near term.
- BNB price started a decent upward move from the $565 support zone.
- The price is now trading above $580 and the 100-hourly simple moving average.
- There was a break above a key bearish trend line with resistance at $582 on the hourly chart of the BNB/USD pair (data source from Binance).
- The pair could extend its increase if it clears the $590 resistance in the near term.
BNB Price Eyes More Upsides
In the past few days, BNB price saw a decent upward move from the $565 support zone, like Ethereum and Bitcoin. The price was able to climb above the $572 and $580 resistance levels.
It even cleared the $582 resistance. The current wave surpassed the 50% Fib retracement level of the downward move from the $597 swing high to the $568 low. Besides, there was a break above a key bearish trend line with resistance at $582 on the hourly chart of the BNB/USD pair.
The price is now trading above $582 and the 100-hourly simple moving average. It is now consolidating near the 61.8% Fib retracement level of the downward move from the $597 swing high to the $568 low.
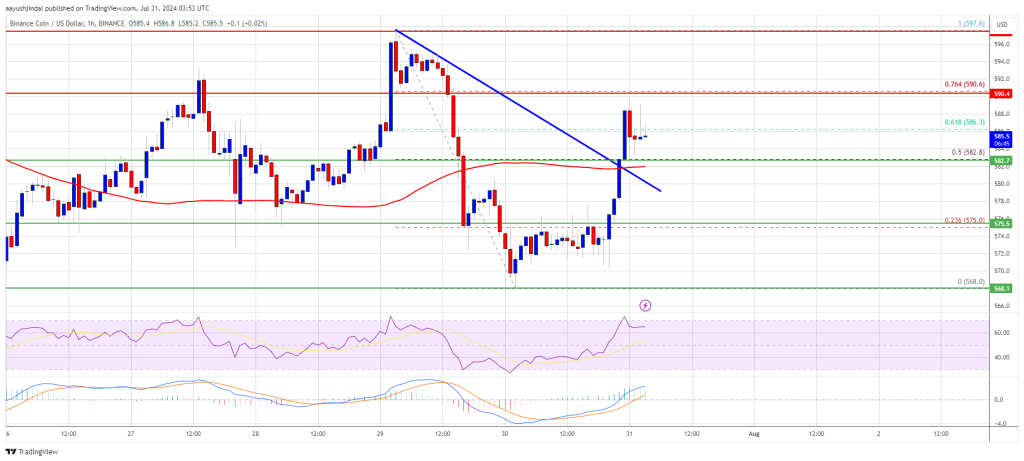
On the upside, the price could face resistance near the $588 level. The next resistance sits near the $590 level. A clear move above the $590 zone could send the price higher. In the stated case, BNB price could test $600. A close above the $600 resistance might set the pace for a larger increase toward the $620 resistance. Any more gains might call for a test of the $632 level in the near term.
Are Dips Limited?
If BNB fails to clear the $590 resistance, it could start a downside correction. Initial support on the downside is near the $582 level or the 100-hourly simple moving average.
The next major support is near the $575 level. The main support sits at $565. If there is a downside break below the $565 support, the price could drop toward the $550 support. Any more losses could initiate a larger decline toward the $532 level.
Technical Indicators
Hourly MACD – The MACD for BNB/USD is gaining pace in the bullish zone.
Hourly RSI (Relative Strength Index) – The RSI for BNB/USD is currently above the 50 level.
Major Support Levels – $582 and $575.
Major Resistance Levels – $590 and $600.
What's Your Reaction?