Cardano (ADA) Dips Under $0.4233: Will the Bears Continue to Rule?
The cryptocurrency market has seen a recent downturn, with Cardano (ADA) experiencing a notable decline, dropping below the $0.4233 mark. This drop can be attributed to the recent shift in market sentiment towards a bearish outlook. The critical question now is whether this bearish momentum will continue or if a potential rebound is on the horizon. This article examines the current market position and technical indicators to offer a comprehensive analysis of the impact of ADA’s price falling below $0.4233. It also evaluates whether this negative momentum will persist or if a potential reversal is on the horizon. In the past day, the price of Cardano has dropped by 5.45%, trading at roughly $0.396 at the time of writing. The cryptocurrency has more than $14 billion in market value and $376 million in trading volume. Over the past day, there has been a 5.35% decrease in ADA’s market capitalization and a 7.32% rise in trading volume. Current Market Overview: ADA’s Recent Decline On the 4-hour chart, the price of ADA is currently bearish and trading below the 100-day Simple Moving Average (SMA) after successfully dropping below $0.4233. It is also important to note that after this break, Cardano has been on a bearish trajectory toward the $0.3389 support level. Also, the signal line of the 4-hour Relative Strength Index (RSI) indicator has fallen below 50%. This decline suggests that ADA could continue its current bearish trend toward the $0.3389 support level. On the 1-day chart, it’s evident that ADA’s price is currently bearish and has significantly fallen below both the 100-day SMA and the $0.4233 support level. Since breaking below the $0.4233 support mark, Cardano has consistently maintained a bearish trajectory toward the $0.3389 support level and will potentially continue in this trend for a while. Finally, it can be observed that the signal line of the 1-day RSI indicator has also dropped below 50% and is currently heading toward the oversold zone. This position of the RSI indicator suggests a potential further decline for ADA. Potential Scenarios: Will Cardano Rebound Or Continue Downward? If Cardano can sustain its current bearish momentum to reach the $0.3389 support mark and close below, the price may continue to move downward to test the $0.2388 support level. Should this level be breached, the digital asset may experience further price drop toward other lower ranges. Conversely, if ADA’s price rebounds at the $0.3389 support level, it could start to move upward again, heading toward the $0.4233 target. Additionally, when ADA breaks above this level, the crypto asset could see further price gains, testing the $0.5229 resistance level and possibly moving towards even higher levels. Featured image from iStock, chart from Tradingview.com

The cryptocurrency market has seen a recent downturn, with Cardano (ADA) experiencing a notable decline, dropping below the $0.4233 mark. This drop can be attributed to the recent shift in market sentiment towards a bearish outlook. The critical question now is whether this bearish momentum will continue or if a potential rebound is on the horizon.
This article examines the current market position and technical indicators to offer a comprehensive analysis of the impact of ADA’s price falling below $0.4233. It also evaluates whether this negative momentum will persist or if a potential reversal is on the horizon.
In the past day, the price of Cardano has dropped by 5.45%, trading at roughly $0.396 at the time of writing. The cryptocurrency has more than $14 billion in market value and $376 million in trading volume. Over the past day, there has been a 5.35% decrease in ADA’s market capitalization and a 7.32% rise in trading volume.
Current Market Overview: ADA’s Recent Decline
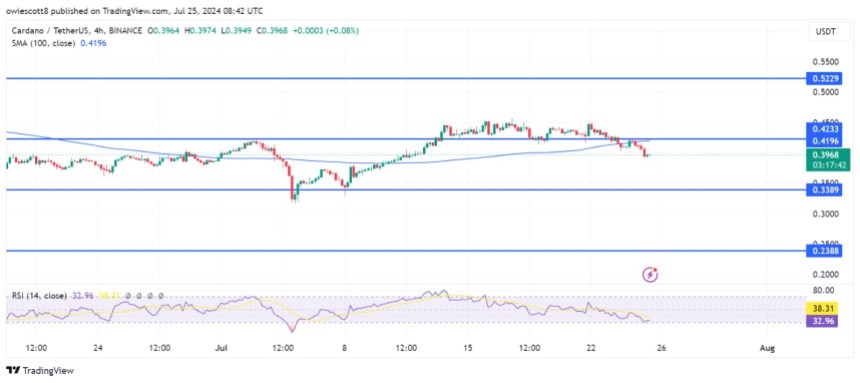
On the 4-hour chart, the price of ADA is currently bearish and trading below the 100-day Simple Moving Average (SMA) after successfully dropping below $0.4233. It is also important to note that after this break, Cardano has been on a bearish trajectory toward the $0.3389 support level.

Also, the signal line of the 4-hour Relative Strength Index (RSI) indicator has fallen below 50%. This decline suggests that ADA could continue its current bearish trend toward the $0.3389 support level.
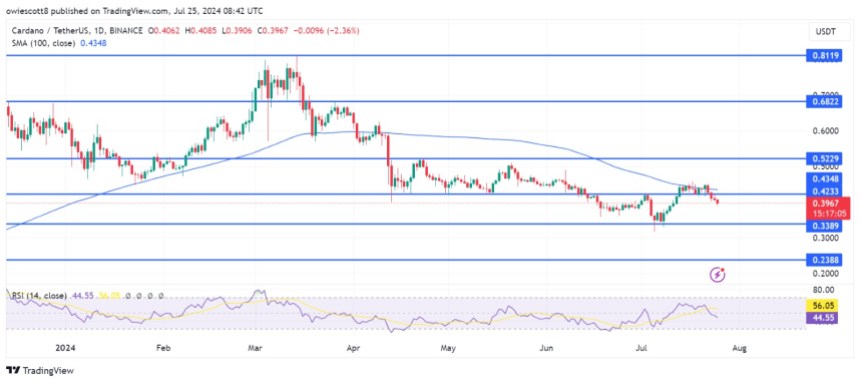
On the 1-day chart, it’s evident that ADA’s price is currently bearish and has significantly fallen below both the 100-day SMA and the $0.4233 support level. Since breaking below the $0.4233 support mark, Cardano has consistently maintained a bearish trajectory toward the $0.3389 support level and will potentially continue in this trend for a while.

Finally, it can be observed that the signal line of the 1-day RSI indicator has also dropped below 50% and is currently heading toward the oversold zone. This position of the RSI indicator suggests a potential further decline for ADA.
Potential Scenarios: Will Cardano Rebound Or Continue Downward?
If Cardano can sustain its current bearish momentum to reach the $0.3389 support mark and close below, the price may continue to move downward to test the $0.2388 support level. Should this level be breached, the digital asset may experience further price drop toward other lower ranges.
Conversely, if ADA’s price rebounds at the $0.3389 support level, it could start to move upward again, heading toward the $0.4233 target. Additionally, when ADA breaks above this level, the crypto asset could see further price gains, testing the $0.5229 resistance level and possibly moving towards even higher levels.
What's Your Reaction?


