Cardano (ADA) Faces Further Decline, $0.3389 Support Under Threat
Cardano (ADA) is currently experiencing a downward trend, with its price approaching the crucial support level of $0.3389. The cryptocurrency market has been under significant bearish pressure, and ADA is no exception. This decline is fueled by a mix of macroeconomic factors, market sentiment, and technical indicators pointing to continued weakness. As Cardano nears this critical support level, investors and traders are closely monitoring its performance to determine if it can hold the line or if further declines are imminent. The $0.3389 level is now a key focus for the market, potentially shaping ADA’s short-term future. With the help of technical indicators, this analysis focuses on analyzing Cardano’s current price action and its impact on the asset’s future focusing on the 4-hour and the 1-day timeframe. Presently, the market capitalization of Cardano is over $13 billion, with a trading volume of over $252 million. The cryptocurrency price is currently down by 2.94%, trading at roughly $0.3786. Despite a 2.91% decrease in market capitalization, there has been a 10.38% increase in trading volume in the past day. Review Of Recent Market Performance Of Cardano Currently, the price of ÀDA is actively bearish trading below the 100-day Simple Moving Average (SMA) in the 4-hour timeframe. Due to this Cardano is beginning to decline towards the $0.3389 support after a failed upward attempt. With this current price action, it can be suggested that ADA’s bearish trend may likely extend. Also, the Relative Strength Index (RSI) confirms that the price of ADA may extend its decline toward the $0.3389 support zone as the signal line of the indicator has dropped below 50% and is heading towards the oversold zone. Meanwhile, on the 1-day chart, ADA’s price is trading below the 100-day SMA dropping towards the $0.3389 support level with strong bearish momentum after short-term upward recovering. Additionally, with the formation of the 1-day RSI, it can be suggested that Cardano poses more of a threat to extending its decline as the signal line of the indicator is actively trending below 50% attempting to make another drop towards the oversold zone. Strategies For Navigating ADA’s Decline An analysis of potential key levels to look out for reveals that ADA’s price may continue to move downward toward the $0.3389 support level. Should the crypto asset break below this level, it may move lower to test the $0.2388 support level and probably move on to test other lower levels if the price breaches this level. However, if there is a rejection at the $0.3389 support level, Cardano may start moving upward toward the $0.5229 resistance level. If this level is breached, the crypto asset may experience more price growth toward the $0.6822 resistance level and possibly other levels above. Featured image from Adobe Stock, chart from Tradingview.com

Cardano (ADA) is currently experiencing a downward trend, with its price approaching the crucial support level of $0.3389. The cryptocurrency market has been under significant bearish pressure, and ADA is no exception.
This decline is fueled by a mix of macroeconomic factors, market sentiment, and technical indicators pointing to continued weakness. As Cardano nears this critical support level, investors and traders are closely monitoring its performance to determine if it can hold the line or if further declines are imminent. The $0.3389 level is now a key focus for the market, potentially shaping ADA’s short-term future.
With the help of technical indicators, this analysis focuses on analyzing Cardano’s current price action and its impact on the asset’s future focusing on the 4-hour and the 1-day timeframe.
Presently, the market capitalization of Cardano is over $13 billion, with a trading volume of over $252 million. The cryptocurrency price is currently down by 2.94%, trading at roughly $0.3786. Despite a 2.91% decrease in market capitalization, there has been a 10.38% increase in trading volume in the past day.
Review Of Recent Market Performance Of Cardano
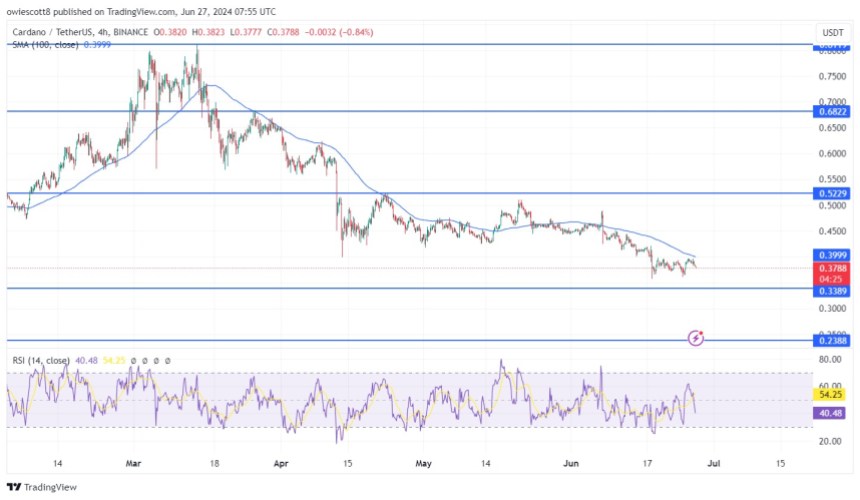
Currently, the price of ÀDA is actively bearish trading below the 100-day Simple Moving Average (SMA) in the 4-hour timeframe. Due to this Cardano is beginning to decline towards the $0.3389 support after a failed upward attempt. With this current price action, it can be suggested that ADA’s bearish trend may likely extend.

Also, the Relative Strength Index (RSI) confirms that the price of ADA may extend its decline toward the $0.3389 support zone as the signal line of the indicator has dropped below 50% and is heading towards the oversold zone.
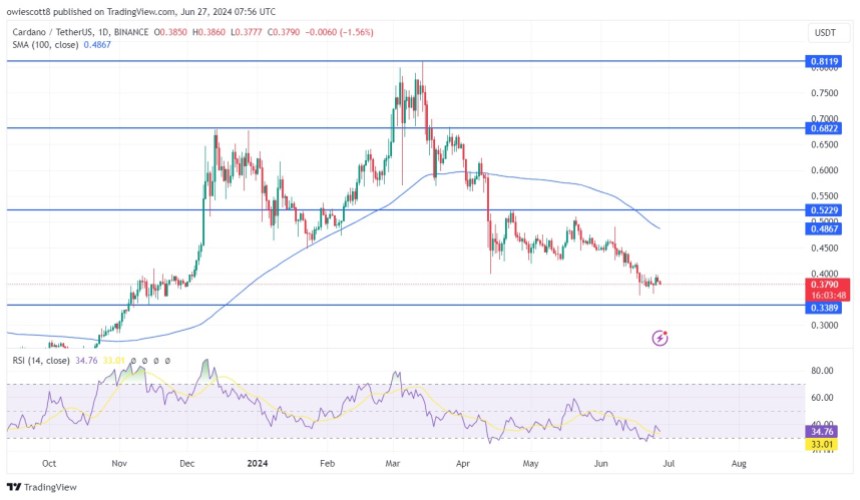
Meanwhile, on the 1-day chart, ADA’s price is trading below the 100-day SMA dropping towards the $0.3389 support level with strong bearish momentum after short-term upward recovering.

Additionally, with the formation of the 1-day RSI, it can be suggested that Cardano poses more of a threat to extending its decline as the signal line of the indicator is actively trending below 50% attempting to make another drop towards the oversold zone.
Strategies For Navigating ADA’s Decline
An analysis of potential key levels to look out for reveals that ADA’s price may continue to move downward toward the $0.3389 support level. Should the crypto asset break below this level, it may move lower to test the $0.2388 support level and probably move on to test other lower levels if the price breaches this level.
However, if there is a rejection at the $0.3389 support level, Cardano may start moving upward toward the $0.5229 resistance level. If this level is breached, the crypto asset may experience more price growth toward the $0.6822 resistance level and possibly other levels above.
What's Your Reaction?


