Dogecoin Set For Heightened Downtrend After A Rejection At $0.1293
Popular meme coin, Dogecoin, recently faced a rejection at a significant resistance level of $0.1293. This setback has led the crypto asset to start a fresh downward move towards its previous low of $0.0914. Since DOGE failed to break past the $0.1293 barrier, this has led to speculations among market participants about the next move of the digital asset. In this article, we will examine the post-rejection price actions of DOGE with the help of technical indicators to determine what this rejection could mean for the crypto asset in the near future. DOGE’s price is currently trading at around $0.121 and is up by 1.85% with a market capitalization of over $17 billion and a trading volume of over $1 billion as of the time of writing. In the last 24 hours, its market cap and trading volume have increased by 1.83% and 73.09% respectively. Recent Market Performance: Analyzing DOGE’s Price Action Currently, the price of Dogecoin on the 4-hour chart is trading below the bearish trendline and has dropped a bearish momentum after the rejection at $0.129 above the 100-day Simple Moving Average (SMA). Based on these current price actions, the digital asset may be poised to maintain its bearish sentiment and could potentially extend its bearish move toward the $0.1144 support level. The formation of the 4-hour Composite Trend Oscillator also suggests a potential bearish continuation for the crypto asset as the signal line has crossed below the SMA of the indicator in the overbought zone attempting to move out of this zone. On the 1-day chart, the price of DOGE is dropping rapidly after failing to break above the $0.129 and the 1-day bearish trendline. It can be observed that the crypto asset is still trading below the 100-day SMA and is currently attempting a bearish move toward the $0.114 support level with a strong bearish momentum. Finally, it can observed that the signal line and the SMA are attempting to move out of the oversold zone. However, this may just be on a short-term note as prices might begin to drop again thereby signaling more bearishness for DOGE. Potential Support Levels: Where Could Dogecoin Find Stability? As of right now, Dogecoin is attempting a bearish move toward the $0.1144 support mark. If the crypto asset breaks below this level, it will continue to move downward toward the $0.0914 support level. A break below this level may trigger more losses for DOGE to test the $0.0745 level and other lower levels. However, if the price of DOGE reaches the $0.1144 support level and experiences a rejection, it will begin to ascend toward the $0.129 resistance level. The crypto asset may pose a further climb toward the $0.1491 resistance level and other higher levels if there is a breach above the $0.129 resistance level. Featured image from Adobe Stock, chart from Tradingview.com

Popular meme coin, Dogecoin, recently faced a rejection at a significant resistance level of $0.1293. This setback has led the crypto asset to start a fresh downward move towards its previous low of $0.0914. Since DOGE failed to break past the $0.1293 barrier, this has led to speculations among market participants about the next move of the digital asset.
In this article, we will examine the post-rejection price actions of DOGE with the help of technical indicators to determine what this rejection could mean for the crypto asset in the near future.
DOGE’s price is currently trading at around $0.121 and is up by 1.85% with a market capitalization of over $17 billion and a trading volume of over $1 billion as of the time of writing. In the last 24 hours, its market cap and trading volume have increased by 1.83% and 73.09% respectively.
Recent Market Performance: Analyzing DOGE’s Price Action
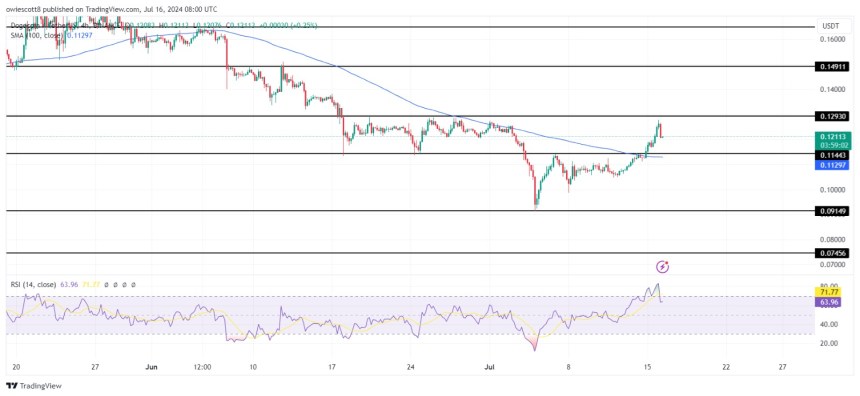
Currently, the price of Dogecoin on the 4-hour chart is trading below the bearish trendline and has dropped a bearish momentum after the rejection at $0.129 above the 100-day Simple Moving Average (SMA). Based on these current price actions, the digital asset may be poised to maintain its bearish sentiment and could potentially extend its bearish move toward the $0.1144 support level.

The formation of the 4-hour Composite Trend Oscillator also suggests a potential bearish continuation for the crypto asset as the signal line has crossed below the SMA of the indicator in the overbought zone attempting to move out of this zone.
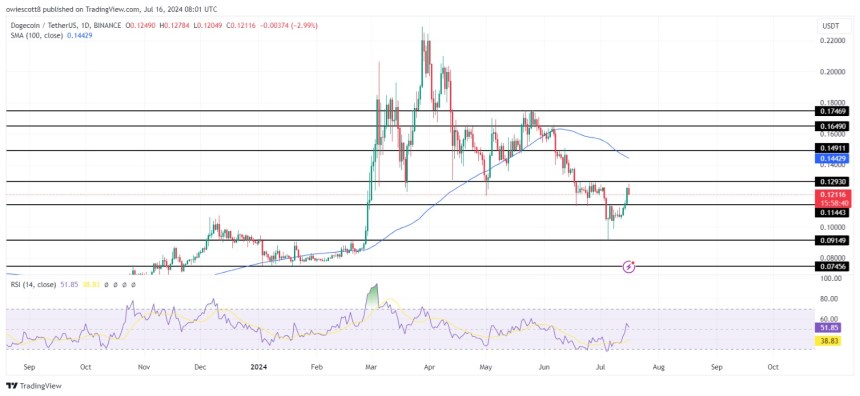
On the 1-day chart, the price of DOGE is dropping rapidly after failing to break above the $0.129 and the 1-day bearish trendline. It can be observed that the crypto asset is still trading below the 100-day SMA and is currently attempting a bearish move toward the $0.114 support level with a strong bearish momentum.

Finally, it can observed that the signal line and the SMA are attempting to move out of the oversold zone. However, this may just be on a short-term note as prices might begin to drop again thereby signaling more bearishness for DOGE.
Potential Support Levels: Where Could Dogecoin Find Stability?
As of right now, Dogecoin is attempting a bearish move toward the $0.1144 support mark. If the crypto asset breaks below this level, it will continue to move downward toward the $0.0914 support level. A break below this level may trigger more losses for DOGE to test the $0.0745 level and other lower levels.
However, if the price of DOGE reaches the $0.1144 support level and experiences a rejection, it will begin to ascend toward the $0.129 resistance level. The crypto asset may pose a further climb toward the $0.1491 resistance level and other higher levels if there is a breach above the $0.129 resistance level.
What's Your Reaction?


