Ethereum Faces $3,500 Hurdle: What’s Next for the Altcoin Giant?
Ethereum price remained stable above the $3,400 resistance zone. ETH again tested $3,500 and seems to be struggling to continue higher. Ethereum is holding gains and struggling near the $3,500 zone. The price is trading above $3,400 and the 100-hourly Simple Moving Average. There is a key bullish trend line forming with support at $3,350 on the hourly chart of ETH/USD (data feed via Kraken). The pair could continue to rise if it clears the $3,500 and $3,550 resistance levels. Ethereum Price Faces Key Hurdle, Can It Continue Higher? Ethereum price remained in a bullish zone above the $3,350 resistance zone. ETH even climbed above the $3,400 resistance to move further into a positive zone. However, the price seems to be facing strong resistance near the $3,500 zone, unlike Bitcoin which surpassed $65,000. A high was formed at $3,515 and the price is now consolidating gains. The price corrected a few points and tested the 23.6% Fib retracement level of the upward wave from the $3,350 swing low to the $3,515 high. Ethereum is now trading above $3,400 and the 100-hourly Simple Moving Average. There is also a key bullish trend line forming with support at $3,350 on the hourly chart of ETH/USD. On the upside, the price is facing resistance near the $3,500 level. The first major resistance is near the $3,520 level. The next major hurdle is near the $3,550 level. A close above the $3,550 level might send Ether toward the $3,650 resistance. The next key resistance is near $3,740. An upside break above the $3,740 resistance might send the price higher toward the $3,800 resistance zone in the coming days. Are Dips Supported In ETH? If Ethereum fails to clear the $3,500 resistance, it could start a downside correction. Initial support on the downside is near $3,420 and the 61.8% Fib retracement level of the upward wave from the $3,350 swing low to the $3,515 high. The first major support sits near the $3,350 zone and the trend line. A clear move below the $3,350 support might push the price toward $3,320. Any more losses might send the price toward the $3,250 support level in the near term. The next key support sits at $3,220. Technical Indicators Hourly MACD – The MACD for ETH/USD is losing momentum in the bullish zone. Hourly RSI – The RSI for ETH/USD is now above the 50 zone. Major Support Level – $3,350 Major Resistance Level – $3,500

Ethereum price remained stable above the $3,400 resistance zone. ETH again tested $3,500 and seems to be struggling to continue higher.
- Ethereum is holding gains and struggling near the $3,500 zone.
- The price is trading above $3,400 and the 100-hourly Simple Moving Average.
- There is a key bullish trend line forming with support at $3,350 on the hourly chart of ETH/USD (data feed via Kraken).
- The pair could continue to rise if it clears the $3,500 and $3,550 resistance levels.
Ethereum Price Faces Key Hurdle, Can It Continue Higher?
Ethereum price remained in a bullish zone above the $3,350 resistance zone. ETH even climbed above the $3,400 resistance to move further into a positive zone. However, the price seems to be facing strong resistance near the $3,500 zone, unlike Bitcoin which surpassed $65,000.
A high was formed at $3,515 and the price is now consolidating gains. The price corrected a few points and tested the 23.6% Fib retracement level of the upward wave from the $3,350 swing low to the $3,515 high.
Ethereum is now trading above $3,400 and the 100-hourly Simple Moving Average. There is also a key bullish trend line forming with support at $3,350 on the hourly chart of ETH/USD. On the upside, the price is facing resistance near the $3,500 level.
The first major resistance is near the $3,520 level. The next major hurdle is near the $3,550 level. A close above the $3,550 level might send Ether toward the $3,650 resistance.
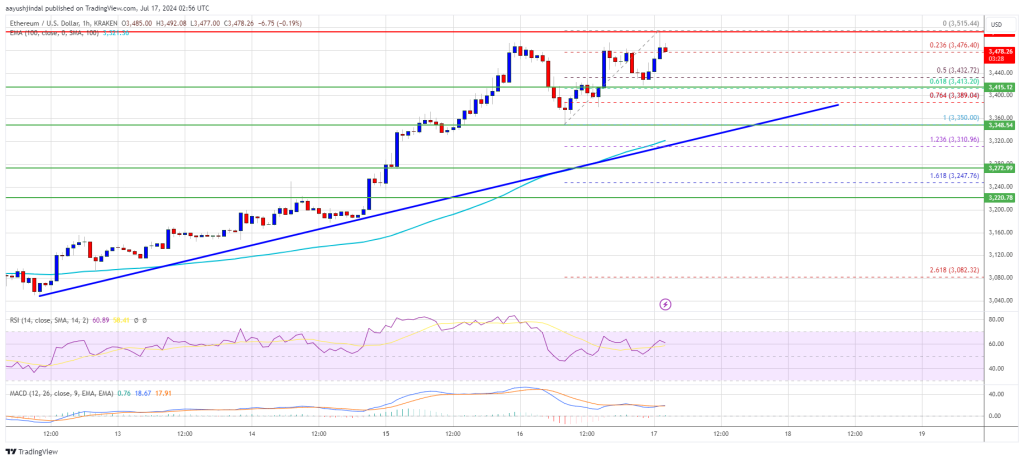
The next key resistance is near $3,740. An upside break above the $3,740 resistance might send the price higher toward the $3,800 resistance zone in the coming days.
Are Dips Supported In ETH?
If Ethereum fails to clear the $3,500 resistance, it could start a downside correction. Initial support on the downside is near $3,420 and the 61.8% Fib retracement level of the upward wave from the $3,350 swing low to the $3,515 high.
The first major support sits near the $3,350 zone and the trend line. A clear move below the $3,350 support might push the price toward $3,320. Any more losses might send the price toward the $3,250 support level in the near term. The next key support sits at $3,220.
Technical Indicators
Hourly MACD – The MACD for ETH/USD is losing momentum in the bullish zone.
Hourly RSI – The RSI for ETH/USD is now above the 50 zone.
Major Support Level – $3,350
Major Resistance Level – $3,500
What's Your Reaction?