

Ethereum Price Poised for Steady Recovery: Can It Build Momentum?
Ethereum price is attempting a recovery wave above $2,380. ETH must clear the $2,440 resistance to continue higher in the near term. Ethereum is attempting a recovery wave from the $2,350 zone. The price is trading below $2,440 and the 100-hourly Simple Moving Average. There is a connecting bearish trend line forming with resistance at $2,400 on the hourly chart of ETH/USD (data feed via Kraken). The pair must clear the $2,440 resistance to continue higher in the near term. Ethereum Price Faces Resistance Ethereum price attempted a recovery wave above the $2,440 level. However, ETH failed to clear the $2,500 resistance zone. A high was formed at $2,488 and the price declined again like Bitcoin. It tested the $2,350 support zone. A low was formed at $2,347 and the price is now attempting a recovery wave. There was a move above the $2,365 and $2,380 resistance levels. The price climbed above the 23.6% Fib retracement level of the downward wave from the $2,488 swing high to the $2,347 low. Ethereum price is now trading below $2,440 and the 100-hourly Simple Moving Average. On the upside, the price seems to be facing hurdles near the $2,400 level. There is also a connecting bearish trend line forming with resistance at $2,400 on the hourly chart of ETH/USD. The first major resistance is near the $2,440 level or the 61.8% Fib retracement level of the downward wave from the $2,488 swing high to the $2,347 low. A close above the $2,440 level might send Ether toward the $2,500 resistance. The next key resistance is near $2,550. An upside break above the $2,550 resistance might send the price higher toward the $2,720 resistance zone in the near term. Another Decline In ETH? If Ethereum fails to clear the $2,440 resistance, it could start another decline. Initial support on the downside is near $2,365. The first major support sits near the $2,350 zone. A clear move below the $2,350 support might push the price toward $2,310. Any more losses might send the price toward the $2,250 support level in the near term. The next key support sits at $2,120. Technical Indicators Hourly MACD – The MACD for ETH/USD is losing momentum in the bearish zone. Hourly RSI – The RSI for ETH/USD is now above the 50 zone. Major Support Level – $2,350 Major Resistance Level – $2,440

Ethereum price is attempting a recovery wave above $2,380. ETH must clear the $2,440 resistance to continue higher in the near term.
- Ethereum is attempting a recovery wave from the $2,350 zone.
- The price is trading below $2,440 and the 100-hourly Simple Moving Average.
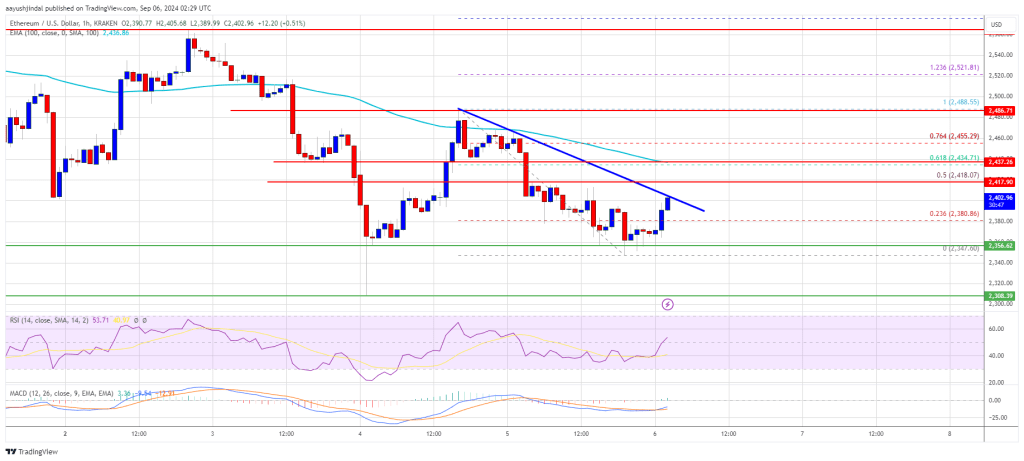
- There is a connecting bearish trend line forming with resistance at $2,400 on the hourly chart of ETH/USD (data feed via Kraken).
- The pair must clear the $2,440 resistance to continue higher in the near term.
Ethereum Price Faces Resistance
Ethereum price attempted a recovery wave above the $2,440 level. However, ETH failed to clear the $2,500 resistance zone. A high was formed at $2,488 and the price declined again like Bitcoin.
It tested the $2,350 support zone. A low was formed at $2,347 and the price is now attempting a recovery wave. There was a move above the $2,365 and $2,380 resistance levels. The price climbed above the 23.6% Fib retracement level of the downward wave from the $2,488 swing high to the $2,347 low.
Ethereum price is now trading below $2,440 and the 100-hourly Simple Moving Average. On the upside, the price seems to be facing hurdles near the $2,400 level. There is also a connecting bearish trend line forming with resistance at $2,400 on the hourly chart of ETH/USD.
The first major resistance is near the $2,440 level or the 61.8% Fib retracement level of the downward wave from the $2,488 swing high to the $2,347 low. A close above the $2,440 level might send Ether toward the $2,500 resistance.
The next key resistance is near $2,550. An upside break above the $2,550 resistance might send the price higher toward the $2,720 resistance zone in the near term.
Another Decline In ETH?
If Ethereum fails to clear the $2,440 resistance, it could start another decline. Initial support on the downside is near $2,365. The first major support sits near the $2,350 zone.
A clear move below the $2,350 support might push the price toward $2,310. Any more losses might send the price toward the $2,250 support level in the near term. The next key support sits at $2,120.
Technical Indicators
Hourly MACD – The MACD for ETH/USD is losing momentum in the bearish zone.
Hourly RSI – The RSI for ETH/USD is now above the 50 zone.
Major Support Level – $2,350
Major Resistance Level – $2,440
What's Your Reaction?