
Ethereum Price Roadblocks: What’s Hindering A Fresh Increase?
Ethereum price struggled to recover above the $3,420 resistance zone. ETH is consolidating and might decline again if there is a move below $3,320. Ethereum is struggling to gain pace for a move above the $3,420 zone. The price is trading below $3,400 and the 100-hourly Simple Moving Average. There is a connecting bearish trend line forming with resistance near $3,400 on the hourly chart of ETH/USD (data feed via Kraken). The pair must clear the $3,400 and $3,425 resistance levels to continue higher. Ethereum Price Faces Hurdles Ethereum price started a decent recovery wave above the $3,320 level. ETH even cleared the $3,350 level but the bears were active near $3,420. A high was formed at $3,426 and the price corrected gains like Bitcoin. There was a move below the $3,380 level. The price dipped below the 23.6% Fib retracement level of the upward move from the $3,230 swing low to the $3,426 high. The bulls are now trying to protect more downsides below the $3,320 level. Ethereum is still trading below $3,400 and the 100-hourly Simple Moving Average. On the upside, the price is facing hurdles near the trend line and $3,400. There is also a connecting bearish trend line forming with resistance near $3,400 on the hourly chart of ETH/USD. The first major resistance is near the $3,420 level. The main resistance is near the $3,450 level. A close above the $3,450 level might send Ether toward the $3,550 resistance. The next key resistance is near $3,620. An upside break above the $3,620 resistance might send the price higher. The next hurdle sits at $3,680, above which the price might gain traction and rise toward the $3,720 level. Any more gains could send Ether toward the $3,880 resistance zone. Another Drop In ETH? If Ethereum fails to clear the $3,400 resistance, it could start another decline. Initial support on the downside is near $3,350. The first major support sits near the $3,320 zone and the 50% Fib retracement level of the upward move from the $3,230 swing low to the $3,426 high. A clear move below the $3,320 support might push the price toward $3,250. Any more losses might send the price toward the $3,200 level in the near term. Technical Indicators Hourly MACD – The MACD for ETH/USD is losing momentum in the bullish zone. Hourly RSI – The RSI for ETH/USD is now above the 50 zone. Major Support Level – $3,320 Major Resistance Level – $3,400

Ethereum price struggled to recover above the $3,420 resistance zone. ETH is consolidating and might decline again if there is a move below $3,320.
- Ethereum is struggling to gain pace for a move above the $3,420 zone.
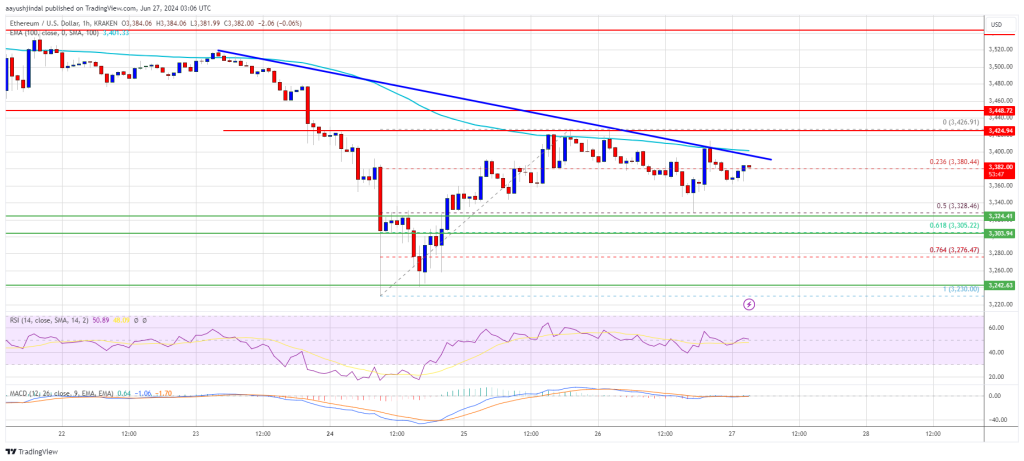
- The price is trading below $3,400 and the 100-hourly Simple Moving Average.
- There is a connecting bearish trend line forming with resistance near $3,400 on the hourly chart of ETH/USD (data feed via Kraken).
- The pair must clear the $3,400 and $3,425 resistance levels to continue higher.
Ethereum Price Faces Hurdles
Ethereum price started a decent recovery wave above the $3,320 level. ETH even cleared the $3,350 level but the bears were active near $3,420. A high was formed at $3,426 and the price corrected gains like Bitcoin.
There was a move below the $3,380 level. The price dipped below the 23.6% Fib retracement level of the upward move from the $3,230 swing low to the $3,426 high. The bulls are now trying to protect more downsides below the $3,320 level.
Ethereum is still trading below $3,400 and the 100-hourly Simple Moving Average. On the upside, the price is facing hurdles near the trend line and $3,400. There is also a connecting bearish trend line forming with resistance near $3,400 on the hourly chart of ETH/USD.
The first major resistance is near the $3,420 level. The main resistance is near the $3,450 level. A close above the $3,450 level might send Ether toward the $3,550 resistance.
The next key resistance is near $3,620. An upside break above the $3,620 resistance might send the price higher. The next hurdle sits at $3,680, above which the price might gain traction and rise toward the $3,720 level. Any more gains could send Ether toward the $3,880 resistance zone.
Another Drop In ETH?
If Ethereum fails to clear the $3,400 resistance, it could start another decline. Initial support on the downside is near $3,350. The first major support sits near the $3,320 zone and the 50% Fib retracement level of the upward move from the $3,230 swing low to the $3,426 high.
A clear move below the $3,320 support might push the price toward $3,250. Any more losses might send the price toward the $3,200 level in the near term.
Technical Indicators
Hourly MACD – The MACD for ETH/USD is losing momentum in the bullish zone.
Hourly RSI – The RSI for ETH/USD is now above the 50 zone.
Major Support Level – $3,320
Major Resistance Level – $3,400
What's Your Reaction?