Ethereum Price Shows Weakness: Can It Overcome The Struggles?
Ethereum price failed to continue higher above the $2,550 resistance zone. ETH is now consolidating near $2,450 and showing a few bearish signs. Ethereum started a recovery wave above the $2,400 and $2,420 levels. The price is trading below $2,550 and the 100-hourly Simple Moving Average. There was a break below a connecting bullish trend line with support at $2,500 on the hourly chart of ETH/USD (data feed via Kraken). The pair could rise steadily if it clears the $2,550 resistance zone. Ethereum Price Struggles Below $2,550 Ethereum price started a recovery wave above the $2,250 resistance level. ETH climbed above the $2,320 and $2,450 resistance levels like Bitcoin above $65,000. However, the bears were active near the $2,550 resistance zone. A high was formed at $2,555 before there was a downside correction. The price declined below the $2,450 level. It dipped below the 23.6% Fib retracement level of the upward move from the $1,911 swing low to the $2,555 high. Besides, there was a break below a connecting bullish trend line with support at $2,500 on the hourly chart of ETH/USD. The pair tested the $2,320 support and is currently rising. Ethereum price is still trading below $2,550 and the 100-hourly Simple Moving Average. On the upside, the price is facing hurdles near the $2,500 level. The first major resistance is near the $2,550 level and the 100-hourly Simple Moving Average. A close above the $2,550 level might send Ether toward the $2,685 resistance. The next key resistance is near $2,865. An upside break above the $2,865 resistance might send the price higher toward the $3,000 resistance zone in the near term. Another Decline In ETH? If Ethereum fails to clear the $2,550 resistance, it could start another decline. Initial support on the downside is near $2,350. The first major support sits near the $2,300 zone. A clear move below the $2,300 support might push the price toward $2,150 and the 61.8% Fib retracement level of the upward move from the $1,911 swing low to the $2,555 high. Any more losses might send the price toward the $2,120 support level in the near term. The next key support sits at $2,050. Technical Indicators Hourly MACD – The MACD for ETH/USD is gaining momentum in the bullish zone. Hourly RSI – The RSI for ETH/USD is now above the 50 zone. Major Support Level – $2,300 Major Resistance Level – $2,550

Ethereum price failed to continue higher above the $2,550 resistance zone. ETH is now consolidating near $2,450 and showing a few bearish signs.
- Ethereum started a recovery wave above the $2,400 and $2,420 levels.
- The price is trading below $2,550 and the 100-hourly Simple Moving Average.
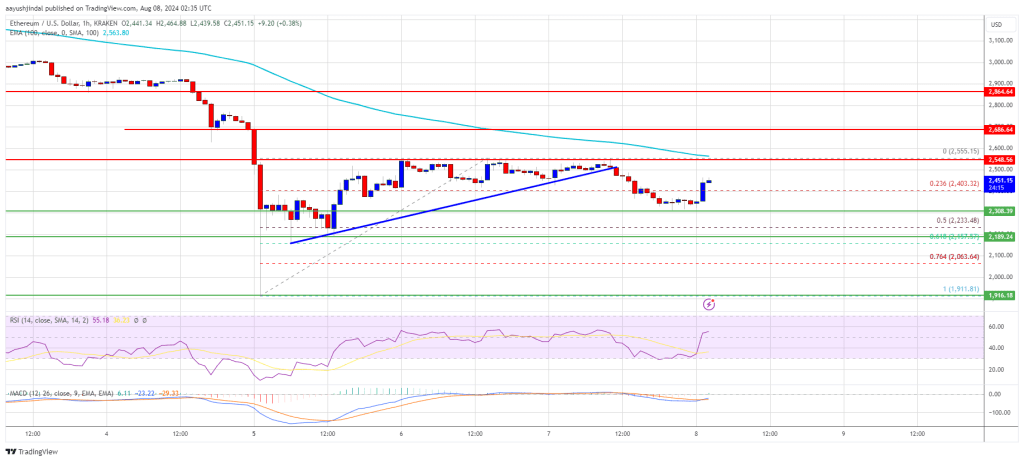
- There was a break below a connecting bullish trend line with support at $2,500 on the hourly chart of ETH/USD (data feed via Kraken).
- The pair could rise steadily if it clears the $2,550 resistance zone.
Ethereum Price Struggles Below $2,550
Ethereum price started a recovery wave above the $2,250 resistance level. ETH climbed above the $2,320 and $2,450 resistance levels like Bitcoin above $65,000.
However, the bears were active near the $2,550 resistance zone. A high was formed at $2,555 before there was a downside correction. The price declined below the $2,450 level. It dipped below the 23.6% Fib retracement level of the upward move from the $1,911 swing low to the $2,555 high.
Besides, there was a break below a connecting bullish trend line with support at $2,500 on the hourly chart of ETH/USD. The pair tested the $2,320 support and is currently rising.
Ethereum price is still trading below $2,550 and the 100-hourly Simple Moving Average. On the upside, the price is facing hurdles near the $2,500 level. The first major resistance is near the $2,550 level and the 100-hourly Simple Moving Average.
A close above the $2,550 level might send Ether toward the $2,685 resistance. The next key resistance is near $2,865. An upside break above the $2,865 resistance might send the price higher toward the $3,000 resistance zone in the near term.
Another Decline In ETH?
If Ethereum fails to clear the $2,550 resistance, it could start another decline. Initial support on the downside is near $2,350. The first major support sits near the $2,300 zone.
A clear move below the $2,300 support might push the price toward $2,150 and the 61.8% Fib retracement level of the upward move from the $1,911 swing low to the $2,555 high. Any more losses might send the price toward the $2,120 support level in the near term. The next key support sits at $2,050.
Technical Indicators
Hourly MACD – The MACD for ETH/USD is gaining momentum in the bullish zone.
Hourly RSI – The RSI for ETH/USD is now above the 50 zone.
Major Support Level – $2,300
Major Resistance Level – $2,550
What's Your Reaction?