Ethereum Reverses Course: Can ETH Bulls Save The Day?
Ethereum price failed to climb above the $3,520 zone and corrected gains. ETH is now showing bearish signs below the $3,400 support zone. Ethereum started a downside correction after it failed to surpass the $3,520 zone. The price is trading below $3,400 and the 100-hourly Simple Moving Average. There is a key bearish trend line forming with resistance near $3,410 on the hourly chart of ETH/USD (data feed via Kraken). The pair is now at risk of more downsides below the $3,350 support zone. Ethereum Price Dips Again Ethereum price failed to continue higher above the $3,520 and $3,550 resistance levels. ETH formed a top near $3,520 and started a fresh decline like Bitcoin. There was a move below the $3,450 and $3,420 support levels. The bears pushed the price below the 50% Fib retracement level of the upward wave from the $3,351 swing low to the $3,516 high. It seems like the price trimmed most gains and might continue to move down below the $3,350 support zone. Ethereum is trading below $3,400 and the 100-hourly Simple Moving Average. It is also below the 76.4% Fib retracement level of the upward wave from the $3,351 swing low to the $3,516 high. If there is a recovery wave, the price might face resistance near the $3,400 level. There is also a key bearish trend line forming with resistance near $3,410 on the hourly chart of ETH/USD. The first major resistance is near the $3,435 level. The next major hurdle is near the $3,465 level. A close above the $3,465 level might send Ether toward the $3,520 resistance. The next key resistance is near $3,550. An upside break above the $3,550 resistance might send the price higher. Any more gains could send Ether toward the $3,650 resistance zone. More Losses In ETH? If Ethereum fails to clear the $3,410 resistance, it could continue to move down. Initial support on the downside is near $3,365. The first major support sits near the $3,350 zone. A clear move below the $3,350 support might push the price toward $3,250. Any more losses might send the price toward the $3,120 level in the near term. Technical Indicators Hourly MACD – The MACD for ETH/USD is gaining momentum in the bearish zone. Hourly RSI – The RSI for ETH/USD is now below the 50 zone. Major Support Level – $3,350 Major Resistance Level – $3,435

Ethereum price failed to climb above the $3,520 zone and corrected gains. ETH is now showing bearish signs below the $3,400 support zone.
- Ethereum started a downside correction after it failed to surpass the $3,520 zone.
- The price is trading below $3,400 and the 100-hourly Simple Moving Average.
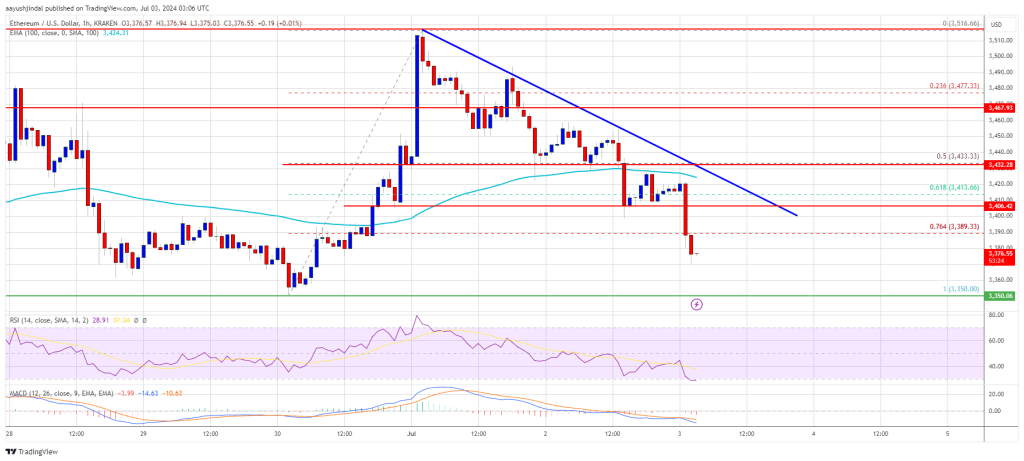
- There is a key bearish trend line forming with resistance near $3,410 on the hourly chart of ETH/USD (data feed via Kraken).
- The pair is now at risk of more downsides below the $3,350 support zone.
Ethereum Price Dips Again
Ethereum price failed to continue higher above the $3,520 and $3,550 resistance levels. ETH formed a top near $3,520 and started a fresh decline like Bitcoin. There was a move below the $3,450 and $3,420 support levels.
The bears pushed the price below the 50% Fib retracement level of the upward wave from the $3,351 swing low to the $3,516 high. It seems like the price trimmed most gains and might continue to move down below the $3,350 support zone.
Ethereum is trading below $3,400 and the 100-hourly Simple Moving Average. It is also below the 76.4% Fib retracement level of the upward wave from the $3,351 swing low to the $3,516 high.
If there is a recovery wave, the price might face resistance near the $3,400 level. There is also a key bearish trend line forming with resistance near $3,410 on the hourly chart of ETH/USD. The first major resistance is near the $3,435 level.
The next major hurdle is near the $3,465 level. A close above the $3,465 level might send Ether toward the $3,520 resistance. The next key resistance is near $3,550. An upside break above the $3,550 resistance might send the price higher. Any more gains could send Ether toward the $3,650 resistance zone.
More Losses In ETH?
If Ethereum fails to clear the $3,410 resistance, it could continue to move down. Initial support on the downside is near $3,365. The first major support sits near the $3,350 zone.
A clear move below the $3,350 support might push the price toward $3,250. Any more losses might send the price toward the $3,120 level in the near term.
Technical Indicators
Hourly MACD – The MACD for ETH/USD is gaining momentum in the bearish zone.
Hourly RSI – The RSI for ETH/USD is now below the 50 zone.
Major Support Level – $3,350
Major Resistance Level – $3,435
What's Your Reaction?