Litecoin Comeback: Bullish Reversal Sets The Stage For $76.85 Target
Litecoin (LTC) is making a strong comeback as a bullish reversal takes place, setting the stage for a potential move toward the $76.85 target. After bouncing off a critical support level, Litecoin has regained upward momentum, signaling renewed optimism among market traders. Key technical indicators now point to further gains, with $76.85 emerging as the next significant resistance level. As the market responds to this bullish shift, this article will delve into Litecoin’s bullish reversal and assess the significance of the $76.85 target and its implications for future price action. Litecoin has increased by 2%, trading around $65.37 in the last 24 hours. Its market capitalization has exceeded $4.8 billion, with a trading volume surpassing $410 million at the time of writing. Litecoin’s market cap has grown by 2%, while its trading volume has surged 42.12%. Analyzing Litecoin’s Bullish Reversal To $76.85 Litecoin’s price on the 4-hour chart is bullish, having crossed above the 100-day Simple Moving Average (SMA) as it approaches the $76.85 level. The digital asset has experienced a significant price increase since rebounding from the $50 support level, signaling a strong rise in positive momentum that could drive further gains. Additionally, an analysis of the 4-hour Relative Strength Index (RSI) shows that the signal line of the indicator has successfully risen above 50% and is currently trending around 63%, suggesting that the bulls are still in control and could drive the price higher. On the 1-day chart, although Litecoin is still trading below the 100-day SMA, it demonstrates upbeat resilience, steadily advancing toward the 100-day SMA and the $76.85 level, with multiple bullish momentum candlesticks forming. This suggests active bullish momentum for the cryptocurrency. Finally, on the 1-day chart, the RSI indicator indicates a rising positive momentum for the cryptocurrency. The RSI signal line has moved out of the overbought zone and is currently attempting a move above 50%. Conclusion: Is Litecoin Poised For A Breakout Beyond $76.85? Recent trading indicates that Litecoin, with its strong bullish momentum, could reach the $76.85 level. If the cryptocurrency reaches and surpasses this resistance, it may trigger further positive moves toward the next resistance at $89.74. If this level is breached, it may lead to further price gain toward the $105.9 resistance level and beyond. Conversely, if bearish pressure prevails and Litecoin fails to break through the $76.85 resistance, the price could decline toward the $57.41 support. A drop below this level may lead to a further decline to test the $50 support, with additional downward movement possible if this range is breached. Featured image from iStock, chart from Tradingview.com

Litecoin (LTC) is making a strong comeback as a bullish reversal takes place, setting the stage for a potential move toward the $76.85 target. After bouncing off a critical support level, Litecoin has regained upward momentum, signaling renewed optimism among market traders. Key technical indicators now point to further gains, with $76.85 emerging as the next significant resistance level.
As the market responds to this bullish shift, this article will delve into Litecoin’s bullish reversal and assess the significance of the $76.85 target and its implications for future price action.
Litecoin has increased by 2%, trading around $65.37 in the last 24 hours. Its market capitalization has exceeded $4.8 billion, with a trading volume surpassing $410 million at the time of writing. Litecoin’s market cap has grown by 2%, while its trading volume has surged 42.12%.
Analyzing Litecoin’s Bullish Reversal To $76.85
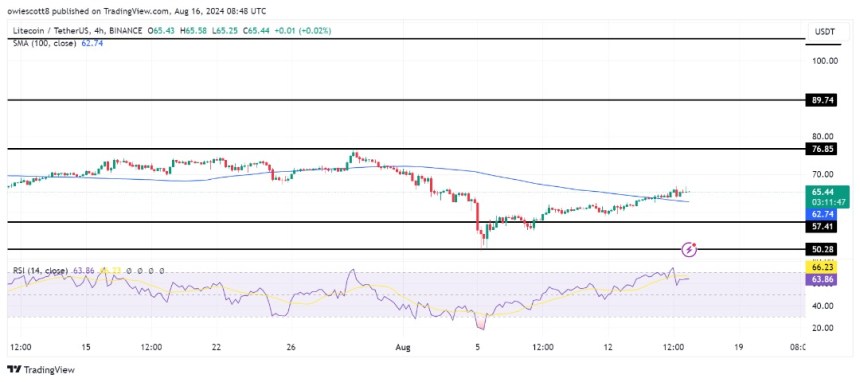
Litecoin’s price on the 4-hour chart is bullish, having crossed above the 100-day Simple Moving Average (SMA) as it approaches the $76.85 level. The digital asset has experienced a significant price increase since rebounding from the $50 support level, signaling a strong rise in positive momentum that could drive further gains.

Additionally, an analysis of the 4-hour Relative Strength Index (RSI) shows that the signal line of the indicator has successfully risen above 50% and is currently trending around 63%, suggesting that the bulls are still in control and could drive the price higher.
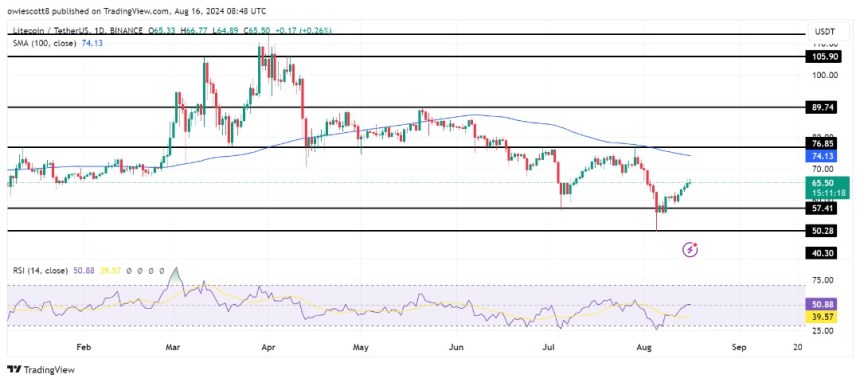
On the 1-day chart, although Litecoin is still trading below the 100-day SMA, it demonstrates upbeat resilience, steadily advancing toward the 100-day SMA and the $76.85 level, with multiple bullish momentum candlesticks forming. This suggests active bullish momentum for the cryptocurrency.

Finally, on the 1-day chart, the RSI indicator indicates a rising positive momentum for the cryptocurrency. The RSI signal line has moved out of the overbought zone and is currently attempting a move above 50%.
Conclusion: Is Litecoin Poised For A Breakout Beyond $76.85?
Recent trading indicates that Litecoin, with its strong bullish momentum, could reach the $76.85 level. If the cryptocurrency reaches and surpasses this resistance, it may trigger further positive moves toward the next resistance at $89.74. If this level is breached, it may lead to further price gain toward the $105.9 resistance level and beyond.
Conversely, if bearish pressure prevails and Litecoin fails to break through the $76.85 resistance, the price could decline toward the $57.41 support. A drop below this level may lead to a further decline to test the $50 support, with additional downward movement possible if this range is breached.
What's Your Reaction?


