Mathematically Forecasting Peak Bitcoin Price For The Next Bull Cycle
Bitcoin’s Bull Cycle Price Predictions: What Historical Patterns Tell Us About the Next Peak.

With years of historical data, we can observe the patterns from past bull cycles to become increasingly capable of making predictions about our current cycle. In this analysis, we take a deep dive into when the next Bitcoin peak may occur and at what price level.
The Pi Cycle
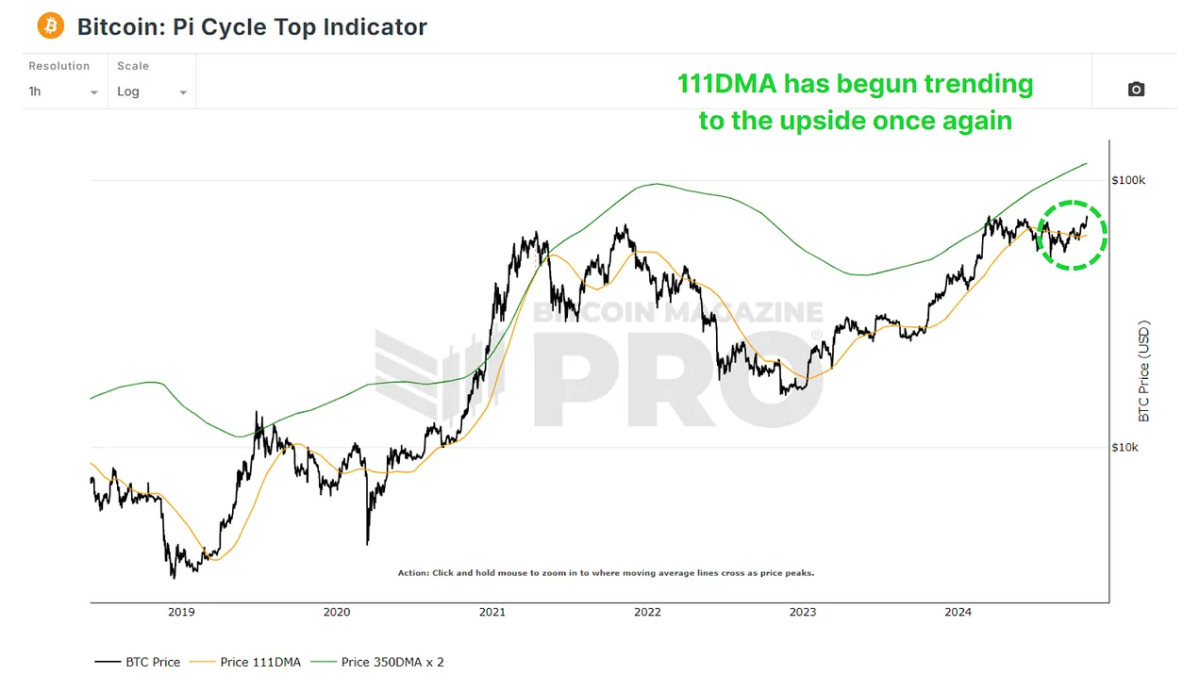
The Pi Cycle Top Indicator is one of our most popular tools for analyzing Bitcoin’s cycles. This indicator monitors the 111-day and 350-day (multiplied by 2) moving averages, and when these two lines cross, it has historically been a reliable sign of Bitcoin reaching a cycle peak, typically within just a few days. After multiple months of these two levels drifting apart due to the sideways price action, we’ve just begun to see the 111-day trending back up again to begin closing the gap.

What's Your Reaction?


