


MATIC Price Prediction: Can Polygon Recover From The Recent Crash?
MATIC price is down over 15% and tested the $0.5150 support. Polygon is slowly recovering, but the bears might be active near $0.5650 and $0.5720. MATIC price started a fresh decline from the $0.6285 resistance zone against the US dollar. The price is trading below $0.570 and the 100-hour simple moving average. There is a key bearish trend line forming with resistance at $0.5720 on the hourly chart of the MATIC/USD pair (data source from Kraken). The pair could recover and test the $0.5720 resistance zone in the near term. Polygon Price Takes Hit After a decent increase, Polygon’s price faced heavy resistance near the $0.6285 zone. MATIC formed a short-term top at $0.6286 and recently started a fresh decline like Bitcoin and Ethereum. There was a sharp move below the $0.600 and $0.5720 support levels. The price even dipped below $0.5250 and tested $0.5150. A low was formed at $0.5151 and the price is now attempting to recover. There was a move above the $0.5350 resistance level. The price climbed above the 23.6% Fib retracement level of the downward move from the $0.6286 swing high to the $0.5151 low. MATIC is trading below $0.560 and the 100 simple moving average (4 hours). Immediate resistance is near the $0.5550 zone. The first major resistance is near the $0.5720 level or the 50% Fib retracement level of the downward move from the $0.6286 swing high to the $0.5151 low. There is also a key bearish trend line forming with resistance at $0.5720 on the hourly chart of the MATIC/USD pair. If there is an upside break above the $0.5720 resistance level, the price could continue to rise. The next major resistance is near $0.5850. A clear move above the $0.5850 resistance could start a steady increase. In the stated case, the price could even attempt a move toward the $0.6285 level or $0.650. Another Decline in MATIC? If MATIC’s price fails to rise above the $0.5720 resistance level, it could start another decline. Immediate support on the downside is near the $0.5320 level. The main support is near the $0.5150 level. A downside break below the $0.5150 level could open the doors for a fresh decline toward $0.50. The next major support is near the $0.4850 level. Technical Indicators Hourly MACD – The MACD for MATIC/USD is gaining momentum in the bearish zone. Hourly RSI (Relative Strength Index) – The RSI for MATIC/USD is now below the 30 level. Major Support Levels – $0.5320 and $0.5150. Major Resistance Levels – $0.5600, $0.5720, and $0.5850.

MATIC price is down over 15% and tested the $0.5150 support. Polygon is slowly recovering, but the bears might be active near $0.5650 and $0.5720.
- MATIC price started a fresh decline from the $0.6285 resistance zone against the US dollar.
- The price is trading below $0.570 and the 100-hour simple moving average.
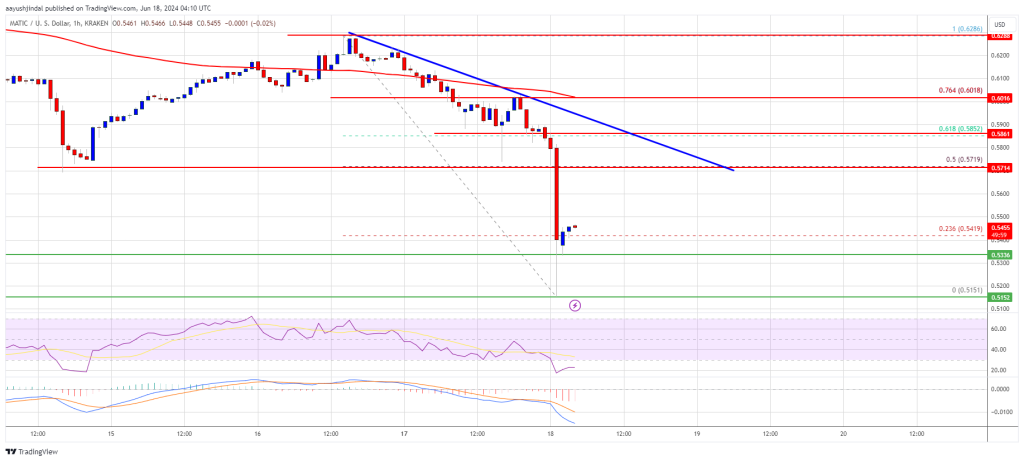
- There is a key bearish trend line forming with resistance at $0.5720 on the hourly chart of the MATIC/USD pair (data source from Kraken).
- The pair could recover and test the $0.5720 resistance zone in the near term.
Polygon Price Takes Hit
After a decent increase, Polygon’s price faced heavy resistance near the $0.6285 zone. MATIC formed a short-term top at $0.6286 and recently started a fresh decline like Bitcoin and Ethereum.
There was a sharp move below the $0.600 and $0.5720 support levels. The price even dipped below $0.5250 and tested $0.5150. A low was formed at $0.5151 and the price is now attempting to recover. There was a move above the $0.5350 resistance level.
The price climbed above the 23.6% Fib retracement level of the downward move from the $0.6286 swing high to the $0.5151 low. MATIC is trading below $0.560 and the 100 simple moving average (4 hours).
Immediate resistance is near the $0.5550 zone. The first major resistance is near the $0.5720 level or the 50% Fib retracement level of the downward move from the $0.6286 swing high to the $0.5151 low. There is also a key bearish trend line forming with resistance at $0.5720 on the hourly chart of the MATIC/USD pair.
If there is an upside break above the $0.5720 resistance level, the price could continue to rise. The next major resistance is near $0.5850. A clear move above the $0.5850 resistance could start a steady increase. In the stated case, the price could even attempt a move toward the $0.6285 level or $0.650.
Another Decline in MATIC?
If MATIC’s price fails to rise above the $0.5720 resistance level, it could start another decline. Immediate support on the downside is near the $0.5320 level.
The main support is near the $0.5150 level. A downside break below the $0.5150 level could open the doors for a fresh decline toward $0.50. The next major support is near the $0.4850 level.
Technical Indicators
Hourly MACD – The MACD for MATIC/USD is gaining momentum in the bearish zone.
Hourly RSI (Relative Strength Index) – The RSI for MATIC/USD is now below the 30 level.
Major Support Levels – $0.5320 and $0.5150.
Major Resistance Levels – $0.5600, $0.5720, and $0.5850.
What's Your Reaction?


