PEPE Faces Potential 5% Drop, Eyes Key Support Level Retest
After a recent breakout, PEPE has experienced a notable drop as it moves to retest crucial support levels. This retest is crucial for the cryptocurrency, as it will determine whether the bullish momentum can continue or if the price will struggle to hold above this level. The aim of this article is to analyze PEPE’s recent price action as it drops to retest critical support at $0.00000766 following a breakout. It will examine whether this support level can hold and lead to a rebound, potentially setting the stage for a renewed upward trend, and explore potential scenarios for its next move. Analyzing The Current Market Condition Of PEPE On the 4-hour chart, PEPE is currently trading above the 100-day Simple Moving Average (SMA), indicating a generally positive trend. However, the crypto asset is experiencing significant bearish momentum that could drive the price down toward the $0.00000766 level for a crucial retest. Additionally, on the 4-hour chart, the Relative Strength Index (RSI) signal line is currently at 66%, moving down from the overbought zone toward the 50% threshold. This decline indicates increasing pessimistic momentum, suggesting a greater likelihood of PEPE approaching the $0.00000766 support level. Related Reading: PEPE Selling Pressure Surges As Price Slips Under $0.00000766 Support On the 4-hour chart, PEPE appears to be moving downward toward the $0.00000766 support level while approaching the 100-day SMA. Despite this short-term decline, the recent bullish market sentiment suggests that this drop may be temporary and could potentially lead to a rebound in the near future. Finally, the 1-day RSI signal line, which has risen to 51%, is now declining towards the 50% level. The drop in the RSI indicates a potential upward momentum weakening, reinforcing the likelihood of a price retracement to the support level for further evaluation. Evaluating PEPE’s Support Test: Can $0.00000766 Hold Firm? If $0.00000766 holds up against the selling pressure, it could indicate a potential rebound and a continuation of the upward trend toward the next resistance at $0.00001152. A successful breach of this resistance level might signal a stronger bullish move, paving the way for further price increases to even higher levels. Related Reading: Buying The Dip: PEPE Price Recovers 10% As Whales Load Their Bags However, if $0.00000766 fails to hold as support, it could lead to additional declines toward the $0.00000589 support level. Should PEPE fall below this level, it may move on to challenge the $0.00000398 range and beyond. Over the past 24 hours, PEPE traded around $0.00007822, reflecting a 6.93% increase. The cryptocurrency’s market capitalization has risen to over $3.2 billion, with trading volume surpassing $527 billion, indicating a 6.94% and 59.38% increase respectively in the past day. Featured image from iStock, chart from Tradingview.com

After a recent breakout, PEPE has experienced a notable drop as it moves to retest crucial support levels. This retest is crucial for the cryptocurrency, as it will determine whether the bullish momentum can continue or if the price will struggle to hold above this level.
The aim of this article is to analyze PEPE’s recent price action as it drops to retest critical support at $0.00000766 following a breakout. It will examine whether this support level can hold and lead to a rebound, potentially setting the stage for a renewed upward trend, and explore potential scenarios for its next move.
Analyzing The Current Market Condition Of PEPE
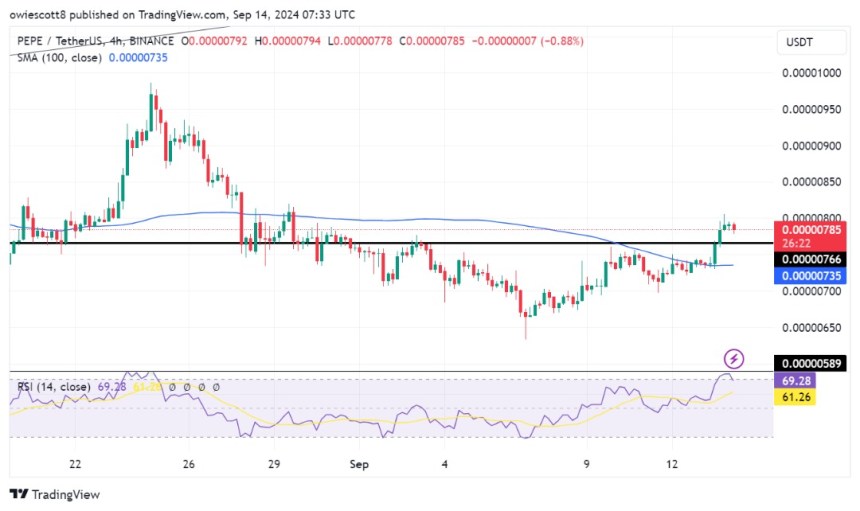
On the 4-hour chart, PEPE is currently trading above the 100-day Simple Moving Average (SMA), indicating a generally positive trend. However, the crypto asset is experiencing significant bearish momentum that could drive the price down toward the $0.00000766 level for a crucial retest.

Additionally, on the 4-hour chart, the Relative Strength Index (RSI) signal line is currently at 66%, moving down from the overbought zone toward the 50% threshold. This decline indicates increasing pessimistic momentum, suggesting a greater likelihood of PEPE approaching the $0.00000766 support level.
On the 4-hour chart, PEPE appears to be moving downward toward the $0.00000766 support level while approaching the 100-day SMA. Despite this short-term decline, the recent bullish market sentiment suggests that this drop may be temporary and could potentially lead to a rebound in the near future.

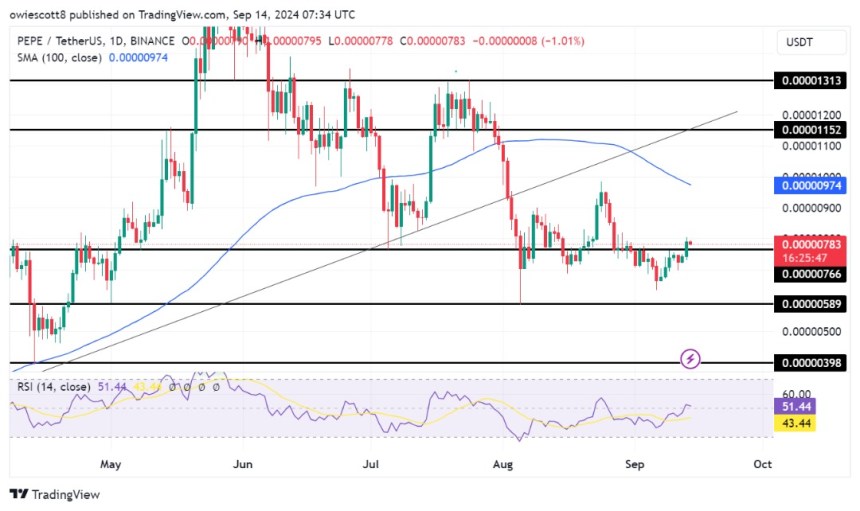
Finally, the 1-day RSI signal line, which has risen to 51%, is now declining towards the 50% level. The drop in the RSI indicates a potential upward momentum weakening, reinforcing the likelihood of a price retracement to the support level for further evaluation.
Evaluating PEPE’s Support Test: Can $0.00000766 Hold Firm?
If $0.00000766 holds up against the selling pressure, it could indicate a potential rebound and a continuation of the upward trend toward the next resistance at $0.00001152. A successful breach of this resistance level might signal a stronger bullish move, paving the way for further price increases to even higher levels.
However, if $0.00000766 fails to hold as support, it could lead to additional declines toward the $0.00000589 support level. Should PEPE fall below this level, it may move on to challenge the $0.00000398 range and beyond.
Over the past 24 hours, PEPE traded around $0.00007822, reflecting a 6.93% increase. The cryptocurrency’s market capitalization has risen to over $3.2 billion, with trading volume surpassing $527 billion, indicating a 6.94% and 59.38% increase respectively in the past day.
What's Your Reaction?


