Solana Cooling Off After 16% Surge? TD Sell Signal Goes Off
An analyst has pointed out how Solana is forming a Tom Demark (TD) Sequential sell signal on three of its charts, which could lead to a cooldown for the asset. Solana Has Just Witnessed A Sell Signal On Three Timeframes In a new post on X, analyst Ali Martinez has discussed the TD Sequential signals Solana is currently observing. The “TD Sequential” here refers to an indicator in technical analysis generally used for locating probable reversal positions in any asset’s price. This indicator has two phases: setup and countdown. In the first of this setup, candles of the same polarity (that is, whether red or green) are counted up to nine. When the ninth candle is reached, the TD Sequential indicates that the price has reached a potential reversal point. Related Reading: XRP Adoption & Activity Spike: What This Means For Its Price Naturally, the indicator would give a sell signal if the candles leading up to the setup’s completion had been green. Similarly, the red nine candles would suggest a bottom for the asset. The second phase, the countdown, kicks off as soon as the setup finishes. This phase works in the same way, except for the fact that candles here are counted up to thirteen instead of nine. Once these thirteen candles are also in, the price could be assumed to have reached another turnaround position. Now, here are the charts shared by Ali, that show the completion of a TD Sequential phase of the former type for Solana on three different timeframes: As the graphs show, Solana has formed a TD Sequential setup with an uptrend on all three daily, four-hour, and hourly timeframes. This would mean that the coin has potentially hit the top. The sell signal has come for the cryptocurrency after it has witnessed a rally of more than 18% over the past week. The pattern doesn’t have to necessarily imply an end of this bullish momentum for the long term, but it could suggest that a cooldown may be coming shortly. Related Reading: Bitcoin Forming A Signal That’s Usually “Very Bullish,” Analyst Says In some other news, a massive transaction has been spotted on the SOL network during the past day, as cryptocurrency transaction tracker service Whale Alert has revealed. In this transfer, a Solana whale transferred 19,068 SOL (equivalent to over $35.1 million when the transaction was executed) from an unknown wallet, likely to be the investor’s self-custodial address, to the Binance exchange. Holders generally transfer to these platforms when they want to use one of the services they offer, which can include selling. Thus, it’s possible that the whale made the move to cash in on the surge that the asset has recently witnessed. SOL Price Solana had surged to the $185 mark yesterday, but has since declined to the $180 level, a potential sign that the TD Sequential setup may be in effect. Featured image from Shutterstock.com, whale-alert.io, chart from TradingView.com

An analyst has pointed out how Solana is forming a Tom Demark (TD) Sequential sell signal on three of its charts, which could lead to a cooldown for the asset.
Solana Has Just Witnessed A Sell Signal On Three Timeframes
In a new post on X, analyst Ali Martinez has discussed the TD Sequential signals Solana is currently observing. The “TD Sequential” here refers to an indicator in technical analysis generally used for locating probable reversal positions in any asset’s price.
This indicator has two phases: setup and countdown. In the first of this setup, candles of the same polarity (that is, whether red or green) are counted up to nine. When the ninth candle is reached, the TD Sequential indicates that the price has reached a potential reversal point.
Naturally, the indicator would give a sell signal if the candles leading up to the setup’s completion had been green. Similarly, the red nine candles would suggest a bottom for the asset.
The second phase, the countdown, kicks off as soon as the setup finishes. This phase works in the same way, except for the fact that candles here are counted up to thirteen instead of nine. Once these thirteen candles are also in, the price could be assumed to have reached another turnaround position.
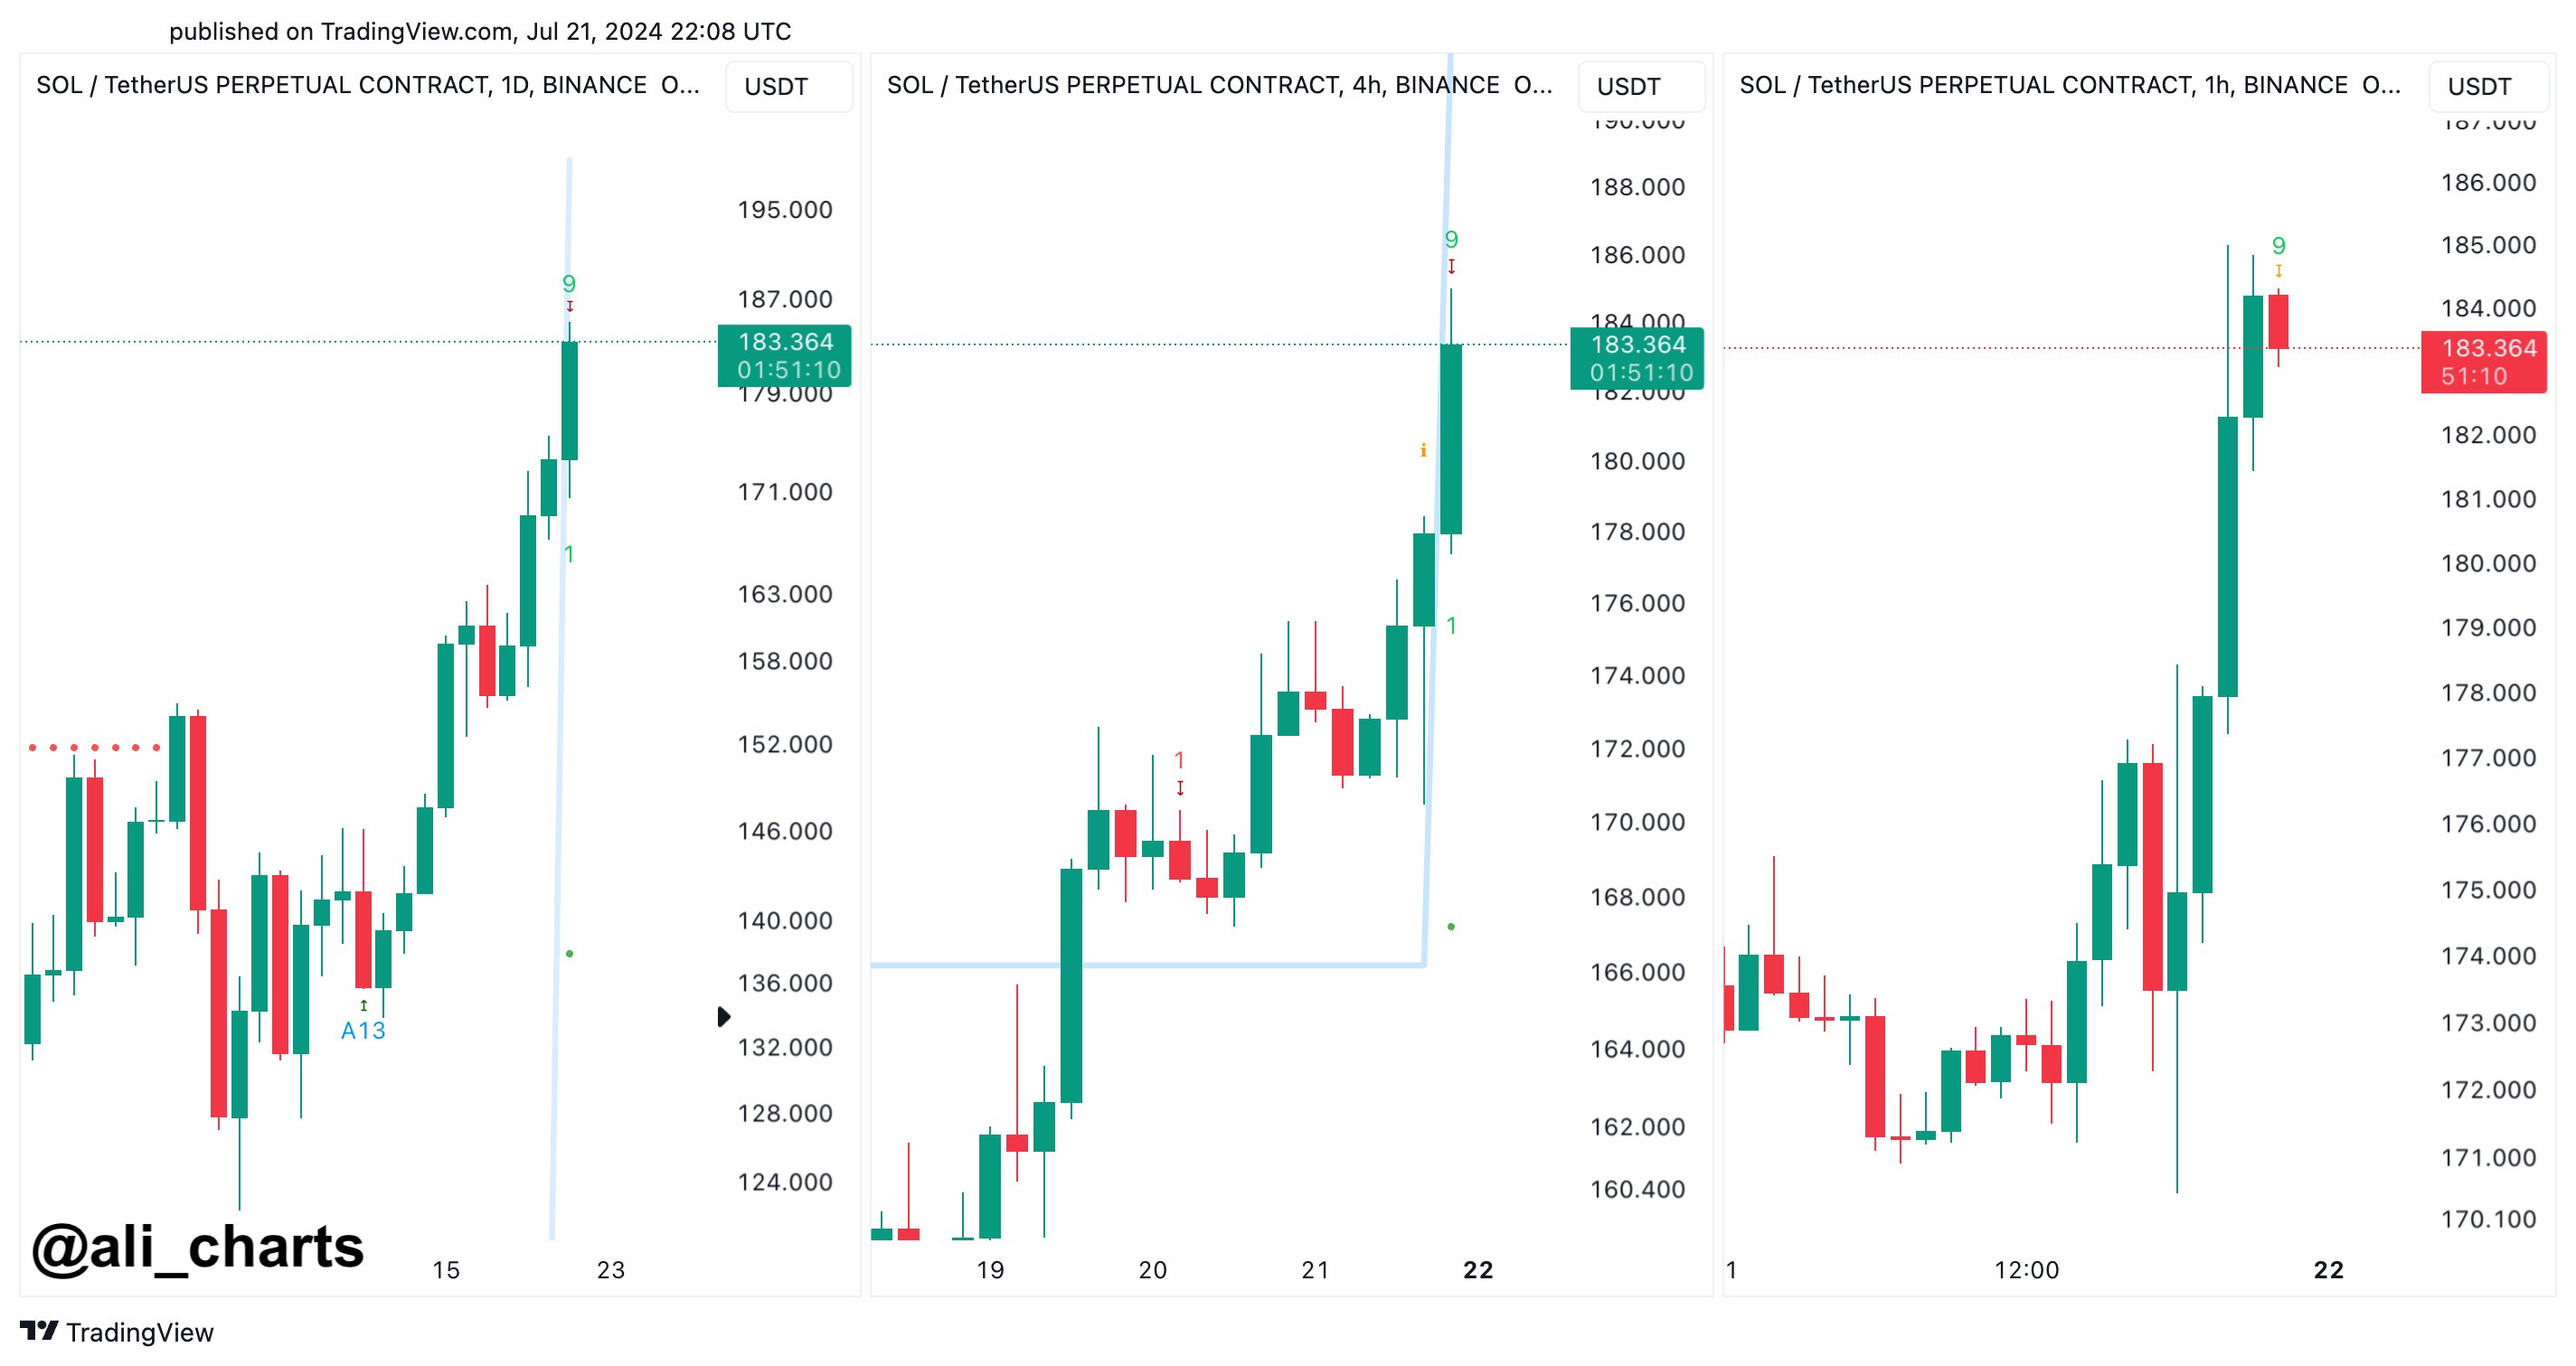
Now, here are the charts shared by Ali, that show the completion of a TD Sequential phase of the former type for Solana on three different timeframes:
As the graphs show, Solana has formed a TD Sequential setup with an uptrend on all three daily, four-hour, and hourly timeframes. This would mean that the coin has potentially hit the top.
The sell signal has come for the cryptocurrency after it has witnessed a rally of more than 18% over the past week. The pattern doesn’t have to necessarily imply an end of this bullish momentum for the long term, but it could suggest that a cooldown may be coming shortly.
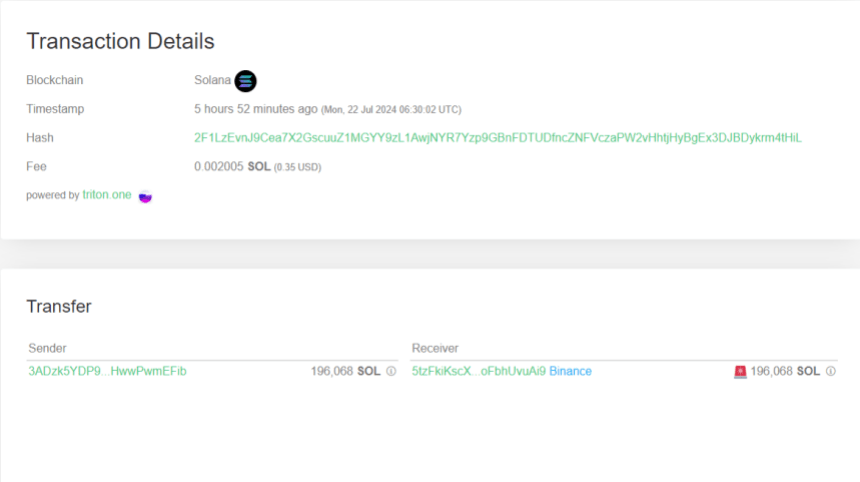
In some other news, a massive transaction has been spotted on the SOL network during the past day, as cryptocurrency transaction tracker service Whale Alert has revealed.

In this transfer, a Solana whale transferred 19,068 SOL (equivalent to over $35.1 million when the transaction was executed) from an unknown wallet, likely to be the investor’s self-custodial address, to the Binance exchange.
Holders generally transfer to these platforms when they want to use one of the services they offer, which can include selling. Thus, it’s possible that the whale made the move to cash in on the surge that the asset has recently witnessed.
SOL Price
Solana had surged to the $185 mark yesterday, but has since declined to the $180 level, a potential sign that the TD Sequential setup may be in effect.
What's Your Reaction?


