Toncoin Rally Thwarted As TON Slips To $6, Can Bulls Prevent A Bearish Breakdown?
Toncoin’s recent bullish momentum has faced a sudden reversal, as the cryptocurrency has slipped back to the critical $6 level. After showing promising signs of a rally, TON faced increased selling pressure, forcing it to retreat to this key support zone. The question here is, Can the bulls defend this level and prevent a deeper bearish breakdown, or is Toncoin poised for a further decline as bearish sentiment grows? Addressing this subject, this article seeks to provide a detailed analysis of Toncoin’s recent price action, focusing on the sudden halt in its bullish momentum and its retreat to the critical $6 support level. Additionally, it will assess what to watch for in Toncoin’s price movements and anticipate its next moves. Toncoin has dropped by 5.19%, currently trading around $6.27 over the past 24 hours. Its market capitalization stands at over $15 billion, with a trading volume exceeding $373 million at the time of writing. TON’s market cap has decreased by 5.21%, while its trading volume has surged by 43.65% The $6 Battleground: Will Bulls Stand Strong? Currently, the price of TON on the 4-hour chart is demonstrating a bullish comeback after hitting the $6 mark and is attempting to move above the 100-day Simple Moving Average (SMA) toward the $6.7 mark. This, therefore, suggests that the bulls are gradually gaining strength over the bears and could further drive the price higher. Additionally, an analysis of the 4-hour Relative Strength Index (RSI) shows that the signal line of the indicator after a successful drop below 50%, is currently rising again toward it, suggesting that buying pressure is increasing and the asset might experience further upward movement. On the 1-day chart, although Toncoin is still trading below the 100-day SMA, the price is currently attempting an upward move toward the $6.7 resistance level after a bullish rejection at $6, which means that the bulls are currently gaining control and could potentially push the price higher. Finally, on the 1-day chart, the RSI signal line is attempting a climb above 50% from the oversold zone, indicating growing bullish momentum for the cryptocurrency. Bullish Defense Or Bearish Takeover: What’s Next For Toncoin? Recent trading activities show that Toncoin has demonstrated bullish defense at the $6 mark and is currently attempting to move toward the $6.7 resistance level. If the crypto asset reaches this level and breaks above, it could lead to a further bearish move toward the next resistance level at $7.7 and possibly other levels beyond. However, if there is a bearish takeover and TON’s price breaks below the $6 mark, the cryptocurrency may continue to decline toward the $4.6 support mark. Should the price fall below this support, it could drop further to test the $3.3 support level and continue to lower support ranges on the chart if the $3.3 price target is breached. Featured image from Adobe Stock, chart from Tradingview.com

Toncoin’s recent bullish momentum has faced a sudden reversal, as the cryptocurrency has slipped back to the critical $6 level. After showing promising signs of a rally, TON faced increased selling pressure, forcing it to retreat to this key support zone. The question here is, Can the bulls defend this level and prevent a deeper bearish breakdown, or is Toncoin poised for a further decline as bearish sentiment grows?
Addressing this subject, this article seeks to provide a detailed analysis of Toncoin’s recent price action, focusing on the sudden halt in its bullish momentum and its retreat to the critical $6 support level. Additionally, it will assess what to watch for in Toncoin’s price movements and anticipate its next moves.
Toncoin has dropped by 5.19%, currently trading around $6.27 over the past 24 hours. Its market capitalization stands at over $15 billion, with a trading volume exceeding $373 million at the time of writing. TON’s market cap has decreased by 5.21%, while its trading volume has surged by 43.65%
The $6 Battleground: Will Bulls Stand Strong?
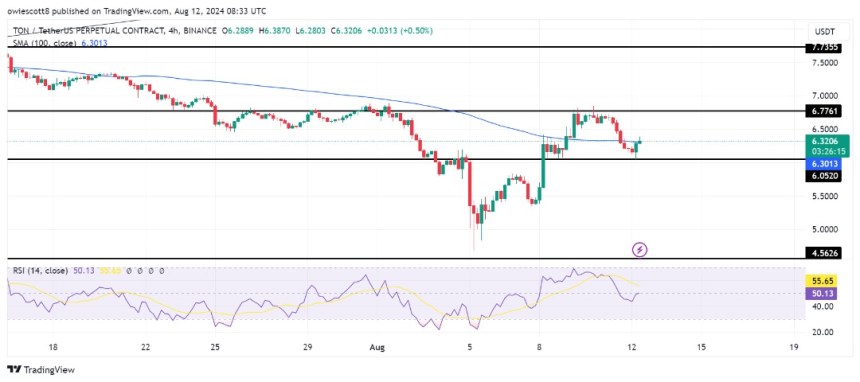
Currently, the price of TON on the 4-hour chart is demonstrating a bullish comeback after hitting the $6 mark and is attempting to move above the 100-day Simple Moving Average (SMA) toward the $6.7 mark. This, therefore, suggests that the bulls are gradually gaining strength over the bears and could further drive the price higher.

Additionally, an analysis of the 4-hour Relative Strength Index (RSI) shows that the signal line of the indicator after a successful drop below 50%, is currently rising again toward it, suggesting that buying pressure is increasing and the asset might experience further upward movement.
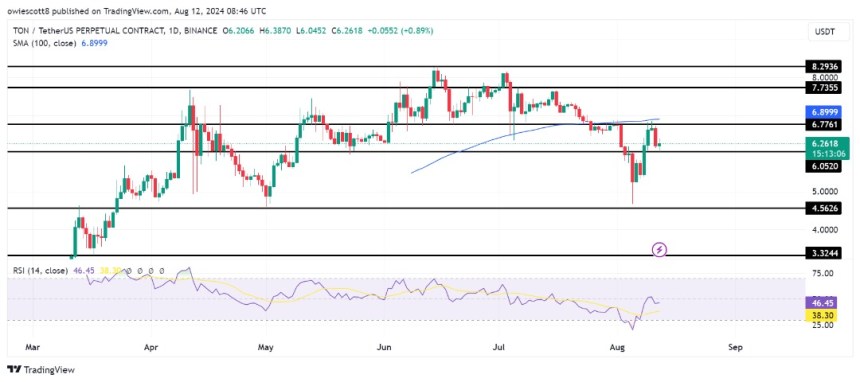
On the 1-day chart, although Toncoin is still trading below the 100-day SMA, the price is currently attempting an upward move toward the $6.7 resistance level after a bullish rejection at $6, which means that the bulls are currently gaining control and could potentially push the price higher.

Finally, on the 1-day chart, the RSI signal line is attempting a climb above 50% from the oversold zone, indicating growing bullish momentum for the cryptocurrency.
Bullish Defense Or Bearish Takeover: What’s Next For Toncoin?
Recent trading activities show that Toncoin has demonstrated bullish defense at the $6 mark and is currently attempting to move toward the $6.7 resistance level. If the crypto asset reaches this level and breaks above, it could lead to a further bearish move toward the next resistance level at $7.7 and possibly other levels beyond.
However, if there is a bearish takeover and TON’s price breaks below the $6 mark, the cryptocurrency may continue to decline toward the $4.6 support mark. Should the price fall below this support, it could drop further to test the $3.3 support level and continue to lower support ranges on the chart if the $3.3 price target is breached.
What's Your Reaction?


