


XRP Price Faces a Dip, Yet Uptrend Support Holds Firm
XRP price struggled near $0.6375 and corrected gains. The price is now trading near $0.540 and might remain stable unless it dives below $0.520. XRP price started a downside correction from the $0.6375 zone. The price is now trading below $0.580 and the 100-hourly Simple Moving Average. There was a break below a connecting bullish trend line with support at $0.580 on the hourly chart of the XRP/USD pair (data source from Kraken). The pair could extend losses if there is a move below $0.540 and $0.520. XRP Price Takes A Hit XRP price struggled to continue higher above the $0.6375 resistance zone and started a fresh decline. The price declined below the $0.620 and $0.600 support levels, like Ethereum and Bitcoin. There was a break below a connecting bullish trend line with support at $0.580 on the hourly chart of the XRP/USD pair. The pair even declined below the $0.5650 support and the 100-hourly Simple Moving Average. A low is formed at $0.5404 and the price is now consolidating losses. The price is now trading below $0.600 and the 100-hourly Simple Moving Average. If there is a fresh upward move, the price could face resistance near the $0.5640 level and the 23.6% Fib retracement level of the recent decline from the $0.6374 swing high to the $0.5404 low. The first major resistance is near the $0.5850 level or the 50% Fib retracement level of the recent decline from the $0.6374 swing high to the $0.5404 low. The next key resistance could be $0.600. A clear move above the $0.600 resistance might send the price toward the $0.620 resistance. The next major resistance is near the $0.6375 level. Any more gains might send the price toward the $0.650 resistance. More Downsides? If XRP fails to clear the $0.5850 resistance zone, it could continue to move down. Initial support on the downside is near the $0.540 level. The next major support is at $0.520. If there is a downside break and a close below the $0.520 level, the price might continue to decline toward the $0.50 support in the near term. Technical Indicators Hourly MACD – The MACD for XRP/USD is now gaining pace in the bearish zone. Hourly RSI (Relative Strength Index) – The RSI for XRP/USD is now below the 50 level. Major Support Levels – $0.540 and $0.520. Major Resistance Levels – $0.5850 and $0.6000.

XRP price struggled near $0.6375 and corrected gains. The price is now trading near $0.540 and might remain stable unless it dives below $0.520.
- XRP price started a downside correction from the $0.6375 zone.
- The price is now trading below $0.580 and the 100-hourly Simple Moving Average.
- There was a break below a connecting bullish trend line with support at $0.580 on the hourly chart of the XRP/USD pair (data source from Kraken).
- The pair could extend losses if there is a move below $0.540 and $0.520.
XRP Price Takes A Hit
XRP price struggled to continue higher above the $0.6375 resistance zone and started a fresh decline. The price declined below the $0.620 and $0.600 support levels, like Ethereum and Bitcoin.
There was a break below a connecting bullish trend line with support at $0.580 on the hourly chart of the XRP/USD pair. The pair even declined below the $0.5650 support and the 100-hourly Simple Moving Average. A low is formed at $0.5404 and the price is now consolidating losses.
The price is now trading below $0.600 and the 100-hourly Simple Moving Average. If there is a fresh upward move, the price could face resistance near the $0.5640 level and the 23.6% Fib retracement level of the recent decline from the $0.6374 swing high to the $0.5404 low.
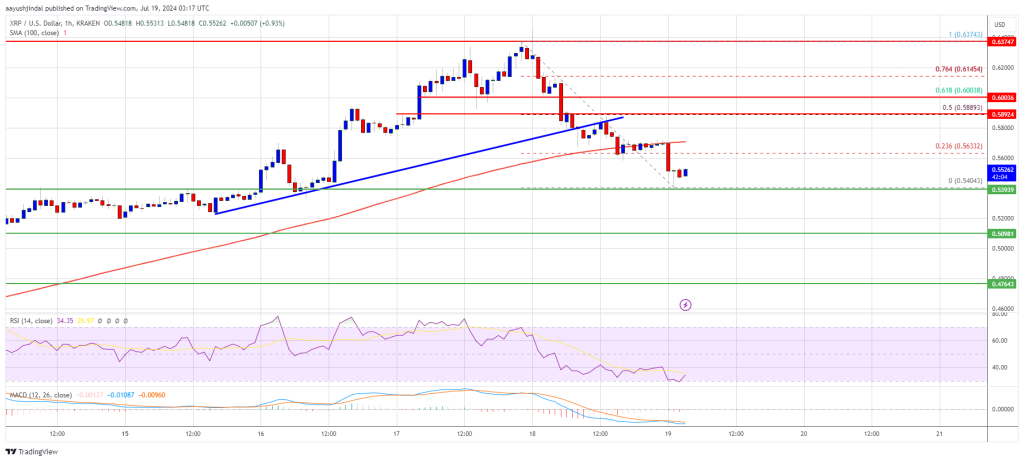
The first major resistance is near the $0.5850 level or the 50% Fib retracement level of the recent decline from the $0.6374 swing high to the $0.5404 low. The next key resistance could be $0.600. A clear move above the $0.600 resistance might send the price toward the $0.620 resistance. The next major resistance is near the $0.6375 level. Any more gains might send the price toward the $0.650 resistance.
More Downsides?
If XRP fails to clear the $0.5850 resistance zone, it could continue to move down. Initial support on the downside is near the $0.540 level. The next major support is at $0.520.
If there is a downside break and a close below the $0.520 level, the price might continue to decline toward the $0.50 support in the near term.
Technical Indicators
Hourly MACD – The MACD for XRP/USD is now gaining pace in the bearish zone.
Hourly RSI (Relative Strength Index) – The RSI for XRP/USD is now below the 50 level.
Major Support Levels – $0.540 and $0.520.
Major Resistance Levels – $0.5850 and $0.6000.
What's Your Reaction?


