XRP Price Faces Challenges: Will It Overcome and Rise?
XRP price is consolidating above the $0.5920 level. The price could start a fresh increase if it clears the $0.6050 resistance zone. XRP price is eyeing a fresh increase from the $0.5920 level. The price is now trading below $0.600 and the 100-hourly Simple Moving Average. There is a connecting bearish trend line forming with resistance at $0.6020 on the hourly chart of the XRP/USD pair (data source from Kraken). The pair could start a fresh increase if it clears the $0.6050 resistance zone. XRP Price Aims Higher XRP price attempted another increase above the $0.6150 level. The price was able to clear the $0.6180 and $0.6220 resistance levels. However, upsides were limited above $0.630 unlike Bitcoin and Ethereum. The price traded as high as $0.6306 and trimmed most gains. It traded as low as $0.5925 and is currently consolidating losses. There was a minor increase above the $0.5950 level. However, the price is now trading below $0.600 and the 100-hourly Simple Moving Average. If there is a fresh increase, the price might face resistance near the $0.60 level. There is also a connecting bearish trend line forming with resistance at $0.6020 on the hourly chart of the XRP/USD pair. It is close to the 23.6% Fib retracement level of the downward move from the $0.6306 swing high to the $0.5925 low. The first major resistance is near the $0.6050 level. The next key resistance could be $0.6160 or the 61.8% Fib retracement level of the downward move from the $0.6306 swing high to the $0.5925 low. A clear move above the $0.6160 resistance might send the price toward the $0.630 resistance. The next major resistance is near the $0.6350 level. Any more gains might send the price toward the $0.6550 resistance or even $0.6880 in the near term. More Downsides? If XRP fails to clear the $0.6050 resistance zone, it could another decline. Initial support on the downside is near the $0.5920 level. The next major support is at $0.5880. If there is a downside break and a close below the $0.5880 level, the price might continue to decline toward the $0.5650 support in the near term. The next major support sits at $0.5550. Technical Indicators Hourly MACD – The MACD for XRP/USD is now losing pace in the bearish zone. Hourly RSI (Relative Strength Index) – The RSI for XRP/USD is now below the 50 level. Major Support Levels – $0.5920 and $0.5850. Major Resistance Levels – $0.6050 and $0.6160.

XRP price is consolidating above the $0.5920 level. The price could start a fresh increase if it clears the $0.6050 resistance zone.
- XRP price is eyeing a fresh increase from the $0.5920 level.
- The price is now trading below $0.600 and the 100-hourly Simple Moving Average.
- There is a connecting bearish trend line forming with resistance at $0.6020 on the hourly chart of the XRP/USD pair (data source from Kraken).
- The pair could start a fresh increase if it clears the $0.6050 resistance zone.
XRP Price Aims Higher
XRP price attempted another increase above the $0.6150 level. The price was able to clear the $0.6180 and $0.6220 resistance levels. However, upsides were limited above $0.630 unlike Bitcoin and Ethereum.
The price traded as high as $0.6306 and trimmed most gains. It traded as low as $0.5925 and is currently consolidating losses. There was a minor increase above the $0.5950 level. However, the price is now trading below $0.600 and the 100-hourly Simple Moving Average.
If there is a fresh increase, the price might face resistance near the $0.60 level. There is also a connecting bearish trend line forming with resistance at $0.6020 on the hourly chart of the XRP/USD pair. It is close to the 23.6% Fib retracement level of the downward move from the $0.6306 swing high to the $0.5925 low.
The first major resistance is near the $0.6050 level. The next key resistance could be $0.6160 or the 61.8% Fib retracement level of the downward move from the $0.6306 swing high to the $0.5925 low.
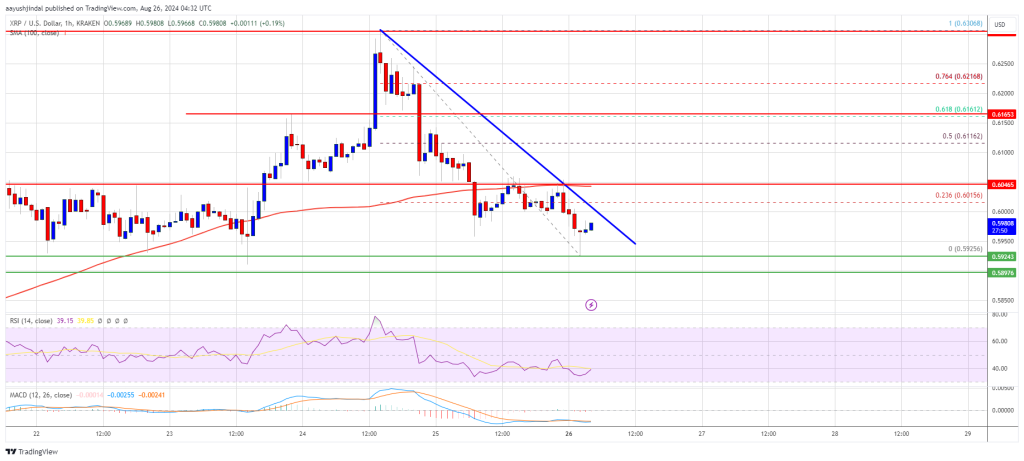
A clear move above the $0.6160 resistance might send the price toward the $0.630 resistance. The next major resistance is near the $0.6350 level. Any more gains might send the price toward the $0.6550 resistance or even $0.6880 in the near term.
More Downsides?
If XRP fails to clear the $0.6050 resistance zone, it could another decline. Initial support on the downside is near the $0.5920 level. The next major support is at $0.5880.
If there is a downside break and a close below the $0.5880 level, the price might continue to decline toward the $0.5650 support in the near term. The next major support sits at $0.5550.
Technical Indicators
Hourly MACD – The MACD for XRP/USD is now losing pace in the bearish zone.
Hourly RSI (Relative Strength Index) – The RSI for XRP/USD is now below the 50 level.
Major Support Levels – $0.5920 and $0.5850.
Major Resistance Levels – $0.6050 and $0.6160.
What's Your Reaction?