

XRP Price Positioned for a Surge: Is Another Rally on the Horizon?
XRP price is holding gains above the $0.5920 zone. The price could gain bullish momentum if it clears the $0.6120 resistance level. XRP price is consolidating gains below the $0.6120 resistance zone. The price is now trading near $0.6050 and the 100-hourly Simple Moving Average. There is a key contracting triangle forming with resistance at $0.6120 on the hourly chart of the XRP/USD pair (data source from Kraken). The pair could start another increase if it stays above the $0.5920 support zone. XRP Price Eyes Fresh Increase XRP price remained stable above the $0.580 support zone. It traded as low as $0.5846 and recently started an upward move. There was a clear move above the $0.600 resistance zone, but it lagged momentum like Bitcoin and Ethereum. There was a move above the 50% Fib retracement level of the downward move from the $0.6257 swing high to the $0.5846 low. It is now trading near $0.6050 and the 100-hourly Simple Moving Average. If there are more upsides, the price could face resistance near the $0.6120 level. There is also a key contracting triangle forming with resistance at $0.6120 on the hourly chart of the XRP/USD pair. The stated triangle resistance is close to the 61.8% Fib retracement level of the downward move from the $0.6257 swing high to the $0.5846 low. The first major resistance is near the $0.6250 level. The next key resistance could be $0.6320. A clear move above the $0.6320 resistance might send the price toward the $0.6450 resistance. The next major resistance is near the $0.6550 level. Any more gains might send the price toward the $0.680 resistance. Another Decline? If XRP fails to clear the $0.6120 resistance zone, it could start another decline. Initial support on the downside is near the $0.6020 level. The next major support is at $0.5920 and the triangle’s trend line zone. If there is a downside break and a close below the $0.5920 level, the price might continue to decline toward the $0.580 support in the near term. The next major support sits at $0.5650. Technical Indicators Hourly MACD – The MACD for XRP/USD is now gaining pace in the bullish zone. Hourly RSI (Relative Strength Index) – The RSI for XRP/USD is now near the 50 level. Major Support Levels – $0.5920 and $0.5800. Major Resistance Levels – $0.6120 and $0.6250.

XRP price is holding gains above the $0.5920 zone. The price could gain bullish momentum if it clears the $0.6120 resistance level.
- XRP price is consolidating gains below the $0.6120 resistance zone.
- The price is now trading near $0.6050 and the 100-hourly Simple Moving Average.
- There is a key contracting triangle forming with resistance at $0.6120 on the hourly chart of the XRP/USD pair (data source from Kraken).
- The pair could start another increase if it stays above the $0.5920 support zone.
XRP Price Eyes Fresh Increase
XRP price remained stable above the $0.580 support zone. It traded as low as $0.5846 and recently started an upward move. There was a clear move above the $0.600 resistance zone, but it lagged momentum like Bitcoin and Ethereum.
There was a move above the 50% Fib retracement level of the downward move from the $0.6257 swing high to the $0.5846 low. It is now trading near $0.6050 and the 100-hourly Simple Moving Average.
If there are more upsides, the price could face resistance near the $0.6120 level. There is also a key contracting triangle forming with resistance at $0.6120 on the hourly chart of the XRP/USD pair. The stated triangle resistance is close to the 61.8% Fib retracement level of the downward move from the $0.6257 swing high to the $0.5846 low.
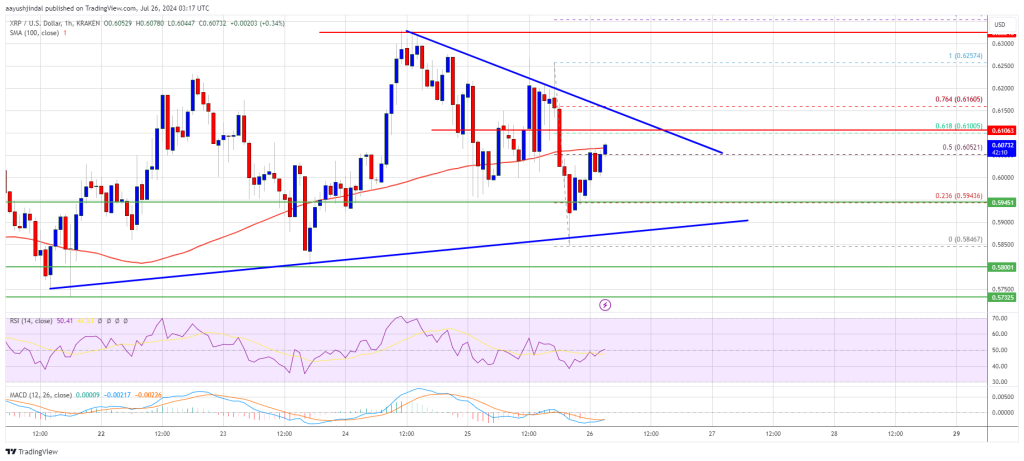
The first major resistance is near the $0.6250 level. The next key resistance could be $0.6320. A clear move above the $0.6320 resistance might send the price toward the $0.6450 resistance. The next major resistance is near the $0.6550 level. Any more gains might send the price toward the $0.680 resistance.
Another Decline?
If XRP fails to clear the $0.6120 resistance zone, it could start another decline. Initial support on the downside is near the $0.6020 level. The next major support is at $0.5920 and the triangle’s trend line zone.
If there is a downside break and a close below the $0.5920 level, the price might continue to decline toward the $0.580 support in the near term. The next major support sits at $0.5650.
Technical Indicators
Hourly MACD – The MACD for XRP/USD is now gaining pace in the bullish zone.
Hourly RSI (Relative Strength Index) – The RSI for XRP/USD is now near the 50 level.
Major Support Levels – $0.5920 and $0.5800.
Major Resistance Levels – $0.6120 and $0.6250.
What's Your Reaction?