


XRP Price Recovery Encounters Hurdles: Will It Prevail?
XRP price started a recovery wave from the $0.4320 support. The price is up over 8% and now faces hurdles near the $0.5120 zone. XRP price traded below the $0.500 and $0.4550 support levels. The price is now trading below $0.5250 and the 100-hourly Simple Moving Average. There is a key bearish trend line forming with resistance at $0.5120 on the hourly chart of the XRP/USD pair (data source from Kraken). The pair could continue to recover higher if it clears the $0.5150 resistance zone. XRP Price Starts Recovery Wave XRP price extended losses below the $0.500 support like Ethereum and Bitcoin. The bears even pushed the price below the $0.4550 support zone. The price tested the $0.4320 zone. A low was formed at $0.4320 and the price recently started a recovery wave. There was a move above the $0.4550 and $0.480 resistance levels. The price climbed above the 50% Fib retracement level of the downward wave from the $0.5765 swing high to the $0.4320 low. The price is still trading below $0.550 and the 100-hourly Simple Moving Average. There is also a key bearish trend line forming with resistance at $0.5120 on the hourly chart of the XRP/USD pair. The bulls are now facing a major hurdle near the trend line and $0.5150. The first major resistance is near the $0.540 level and the 100-hourly Simple Moving Average. It is close to the 76.4% Fib retracement level of the downward wave from the $0.5765 swing high to the $0.4320 low. The next key resistance could be $0.550. A clear move above the $0.550 resistance might send the price toward the $0.5550 resistance. The next major resistance is near the $0.5680 level. Any more gains might send the price toward the $0.580 resistance or even $0.5880 in the near term. Another Decline? If XRP fails to clear the $0.5120 resistance zone, it could start another decline. Initial support on the downside is near the $0.4880 level. The next major support is at $0.4750. If there is a downside break and a close below the $0.4750 level, the price might continue to decline toward the $0.4500 support in the near term. The next major support sits at $0.4320. Technical Indicators Hourly MACD – The MACD for XRP/USD is now gaining pace in the bullish zone. Hourly RSI (Relative Strength Index) – The RSI for XRP/USD is now above the 50 level. Major Support Levels – $0.4880 and $0.4750. Major Resistance Levels – $0.5120 and $0.5400.

XRP price started a recovery wave from the $0.4320 support. The price is up over 8% and now faces hurdles near the $0.5120 zone.
- XRP price traded below the $0.500 and $0.4550 support levels.
- The price is now trading below $0.5250 and the 100-hourly Simple Moving Average.
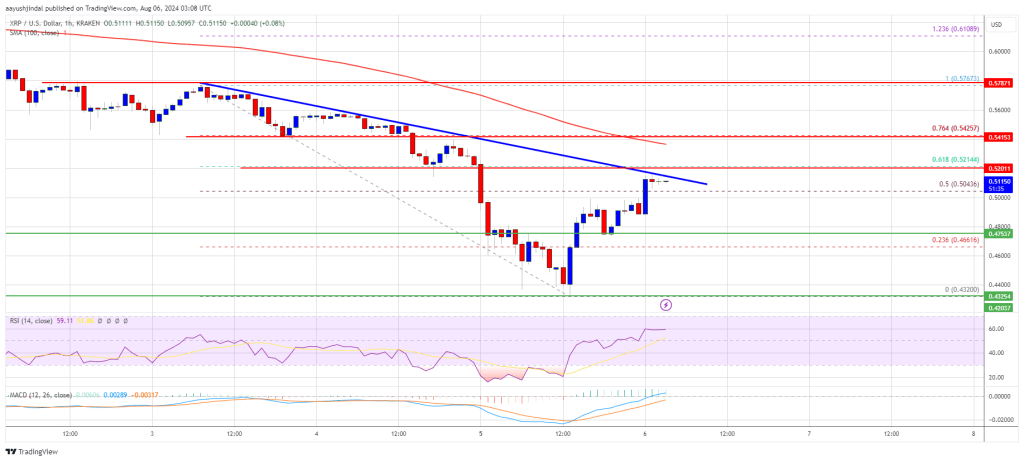
- There is a key bearish trend line forming with resistance at $0.5120 on the hourly chart of the XRP/USD pair (data source from Kraken).
- The pair could continue to recover higher if it clears the $0.5150 resistance zone.
XRP Price Starts Recovery Wave
XRP price extended losses below the $0.500 support like Ethereum and Bitcoin. The bears even pushed the price below the $0.4550 support zone.
The price tested the $0.4320 zone. A low was formed at $0.4320 and the price recently started a recovery wave. There was a move above the $0.4550 and $0.480 resistance levels. The price climbed above the 50% Fib retracement level of the downward wave from the $0.5765 swing high to the $0.4320 low.
The price is still trading below $0.550 and the 100-hourly Simple Moving Average. There is also a key bearish trend line forming with resistance at $0.5120 on the hourly chart of the XRP/USD pair.
The bulls are now facing a major hurdle near the trend line and $0.5150. The first major resistance is near the $0.540 level and the 100-hourly Simple Moving Average. It is close to the 76.4% Fib retracement level of the downward wave from the $0.5765 swing high to the $0.4320 low.
The next key resistance could be $0.550. A clear move above the $0.550 resistance might send the price toward the $0.5550 resistance. The next major resistance is near the $0.5680 level. Any more gains might send the price toward the $0.580 resistance or even $0.5880 in the near term.
Another Decline?
If XRP fails to clear the $0.5120 resistance zone, it could start another decline. Initial support on the downside is near the $0.4880 level. The next major support is at $0.4750.
If there is a downside break and a close below the $0.4750 level, the price might continue to decline toward the $0.4500 support in the near term. The next major support sits at $0.4320.
Technical Indicators
Hourly MACD – The MACD for XRP/USD is now gaining pace in the bullish zone.
Hourly RSI (Relative Strength Index) – The RSI for XRP/USD is now above the 50 level.
Major Support Levels – $0.4880 and $0.4750.
Major Resistance Levels – $0.5120 and $0.5400.
What's Your Reaction?