
XRP Price Regains $0.60: Key Levels to Watch Moving Forward
XRP price extended its increase above the $0.600 resistance zone. The price is consolidating gains and might correct lower toward the $0.5850 support. XRP price started another increase above the $0.60 resistance zone. The price is now trading above $0.5850 and the 100-hourly Simple Moving Average. There is a key bullish trend line forming with support at $0.5820 on the hourly chart of the XRP/USD pair (data source from Kraken). The pair could correct lower, but the bulls might be active near the $0.5850 level. XRP Price Clears The $0.60 Hurdle XRP price remained stable above the $0.550 level and started a fresh increase. The price broke the $0.5850 resistance and extended gains, whereas Ethereum and Bitcoin struggled to continue higher. The price even cleared the $0.60 resistance, as discussed in the previous analysis. It price traded as high as $0.6374 and is currently correcting gains. There was a minor decline below $0.620. The price declined below the 23.6% Fib retracement level of the upward move from the $0.5330 swing low to the $0.6374 high. The price is now trading above $0.600 and the 100-hourly Simple Moving Average. Besides, there is a key bullish trend line forming with support at $0.5820 on the hourly chart of the XRP/USD pair. The trend line is close to the 50% Fib retracement level of the upward move from the $0.5330 swing low to the $0.6374 high. On the upside, the price is facing resistance near the $0.620 level. The first major resistance is near the $0.6350 level. The next key resistance could be $0.6420. A clear move above the $0.6420 resistance might send the price toward the $0.650 resistance. The next major resistance is near the $0.6550 level. Any more gains might send the price toward the $0.680 resistance. Are Dips Limited? If XRP fails to clear the $0.620 resistance zone, it could start a downside correction. Initial support on the downside is near the $0.600 level. The next major support is at $0.5850 and the trend line. If there is a downside break and a close below the $0.5850 level, the price might continue to decline toward the $0.550 support in the near term. Technical Indicators Hourly MACD – The MACD for XRP/USD is now losing pace in the bullish zone. Hourly RSI (Relative Strength Index) – The RSI for XRP/USD is now below the 50 level. Major Support Levels – $0.5850 and $0.5500. Major Resistance Levels – $0.620 and $0.6350.

XRP price extended its increase above the $0.600 resistance zone. The price is consolidating gains and might correct lower toward the $0.5850 support.
- XRP price started another increase above the $0.60 resistance zone.
- The price is now trading above $0.5850 and the 100-hourly Simple Moving Average.
- There is a key bullish trend line forming with support at $0.5820 on the hourly chart of the XRP/USD pair (data source from Kraken).
- The pair could correct lower, but the bulls might be active near the $0.5850 level.
XRP Price Clears The $0.60 Hurdle
XRP price remained stable above the $0.550 level and started a fresh increase. The price broke the $0.5850 resistance and extended gains, whereas Ethereum and Bitcoin struggled to continue higher.
The price even cleared the $0.60 resistance, as discussed in the previous analysis. It price traded as high as $0.6374 and is currently correcting gains. There was a minor decline below $0.620. The price declined below the 23.6% Fib retracement level of the upward move from the $0.5330 swing low to the $0.6374 high.
The price is now trading above $0.600 and the 100-hourly Simple Moving Average. Besides, there is a key bullish trend line forming with support at $0.5820 on the hourly chart of the XRP/USD pair. The trend line is close to the 50% Fib retracement level of the upward move from the $0.5330 swing low to the $0.6374 high.
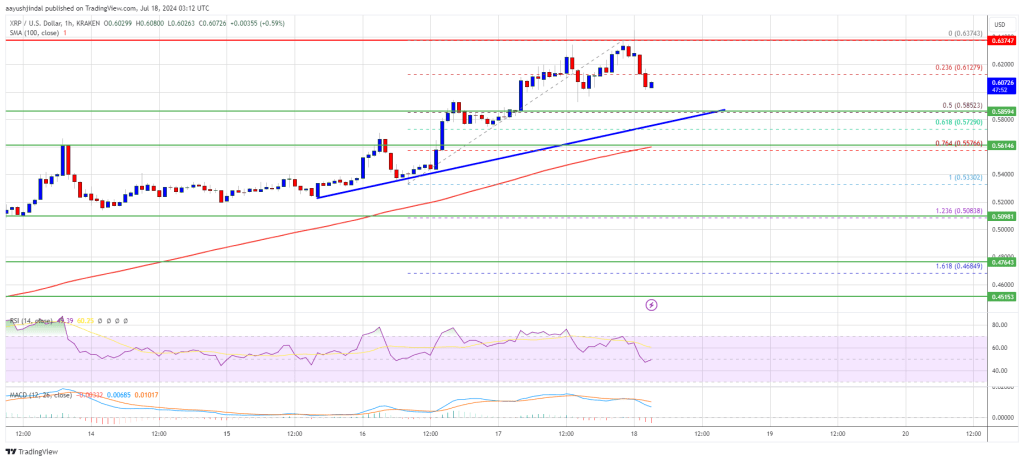
On the upside, the price is facing resistance near the $0.620 level. The first major resistance is near the $0.6350 level. The next key resistance could be $0.6420. A clear move above the $0.6420 resistance might send the price toward the $0.650 resistance. The next major resistance is near the $0.6550 level. Any more gains might send the price toward the $0.680 resistance.
Are Dips Limited?
If XRP fails to clear the $0.620 resistance zone, it could start a downside correction. Initial support on the downside is near the $0.600 level. The next major support is at $0.5850 and the trend line.
If there is a downside break and a close below the $0.5850 level, the price might continue to decline toward the $0.550 support in the near term.
Technical Indicators
Hourly MACD – The MACD for XRP/USD is now losing pace in the bullish zone.
Hourly RSI (Relative Strength Index) – The RSI for XRP/USD is now below the 50 level.
Major Support Levels – $0.5850 and $0.5500.
Major Resistance Levels – $0.620 and $0.6350.
What's Your Reaction?