


XRP Price Soars 20% Then Corrects: Is Another Rally on the Horizon?
XRP price gained bullish momentum above the $0.50 resistance zone. The price is consolidating gains and might aim for another move above the $0.5450 resistance zone. XRP price gained over 20% in a few days and broke the $0.500 zone. The price is now trading above $0.5050 and the 100-hourly Simple Moving Average. There is a short-term contracting triangle forming with support at $0.520 on the hourly chart of the XRP/USD pair (data source from Kraken). The pair could extend gains if there is a close above the $0.540 resistance level. XRP Price Regains Strength XRP price remained in a positive zone above the $0.440 level and extended its recovery wave. It gained over 20% in a few days, outperforming Ethereum and Bitcoin. The price was able to climb above the $0.5050 and $0.5200 resistance levels. The price even cleared the $0.5450 level and spiked above $0.550. A high was formed at $0.5659 and the price corrected gains. There was a minor decline below the $0.5450 level. The price tested the $0.5150 support zone. A low was formed at $0.5140 and the price is now consolidating. There was a move above the 23.6% Fib retracement level of the downward move from the $0.5659 swing high to the $0.5140 low. The price is now trading above $0.520 and the 100-hourly Simple Moving Average. Besides, there is a short-term contracting triangle forming with support at $0.520 on the hourly chart of the XRP/USD pair. On the upside, the price is facing resistance near the $0.5290 level. The first major resistance is near the $0.5320 level. The next key resistance could be $0.5450. A clear move above the $0.5450 resistance might send the price toward the $0.5650 resistance. The next major resistance is near the $0.5880 level. Any more gains might send the price toward the $0.600 resistance. Are Dips Supported? If XRP fails to clear the $0.5450 resistance zone, it could start a downside correction. Initial support on the downside is near the $0.520 level. The next major support is at $0.5150. If there is a downside break and a close below the $0.5150 level, the price might continue to decline toward the $0.490 support in the near term. Technical Indicators Hourly MACD – The MACD for XRP/USD is now losing pace in the bullish zone. Hourly RSI (Relative Strength Index) – The RSI for XRP/USD is now above the 50 level. Major Support Levels – $0.5200 and $0.5150. Major Resistance Levels – $0.5320 and $0.5450.

XRP price gained bullish momentum above the $0.50 resistance zone. The price is consolidating gains and might aim for another move above the $0.5450 resistance zone.
- XRP price gained over 20% in a few days and broke the $0.500 zone.
- The price is now trading above $0.5050 and the 100-hourly Simple Moving Average.
- There is a short-term contracting triangle forming with support at $0.520 on the hourly chart of the XRP/USD pair (data source from Kraken).
- The pair could extend gains if there is a close above the $0.540 resistance level.
XRP Price Regains Strength
XRP price remained in a positive zone above the $0.440 level and extended its recovery wave. It gained over 20% in a few days, outperforming Ethereum and Bitcoin. The price was able to climb above the $0.5050 and $0.5200 resistance levels.
The price even cleared the $0.5450 level and spiked above $0.550. A high was formed at $0.5659 and the price corrected gains. There was a minor decline below the $0.5450 level. The price tested the $0.5150 support zone. A low was formed at $0.5140 and the price is now consolidating.
There was a move above the 23.6% Fib retracement level of the downward move from the $0.5659 swing high to the $0.5140 low. The price is now trading above $0.520 and the 100-hourly Simple Moving Average. Besides, there is a short-term contracting triangle forming with support at $0.520 on the hourly chart of the XRP/USD pair.
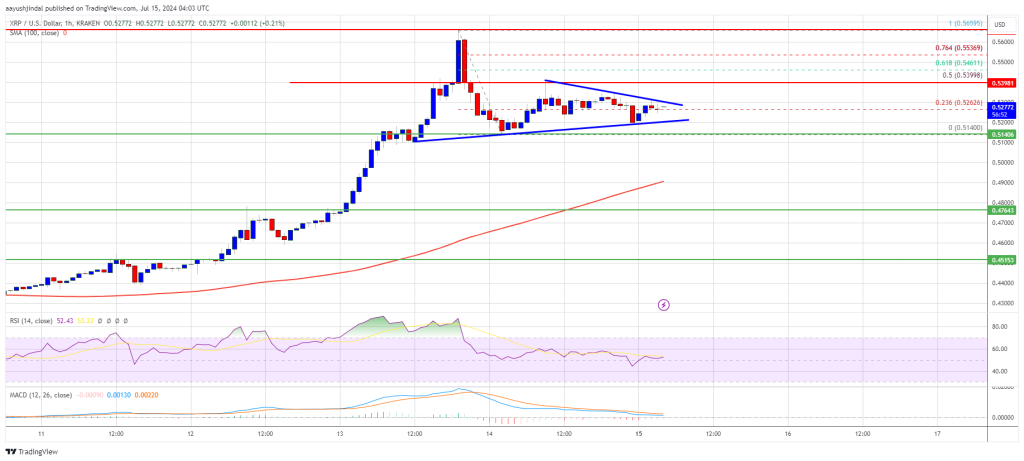
On the upside, the price is facing resistance near the $0.5290 level. The first major resistance is near the $0.5320 level. The next key resistance could be $0.5450. A clear move above the $0.5450 resistance might send the price toward the $0.5650 resistance. The next major resistance is near the $0.5880 level. Any more gains might send the price toward the $0.600 resistance.
Are Dips Supported?
If XRP fails to clear the $0.5450 resistance zone, it could start a downside correction. Initial support on the downside is near the $0.520 level.
The next major support is at $0.5150. If there is a downside break and a close below the $0.5150 level, the price might continue to decline toward the $0.490 support in the near term.
Technical Indicators
Hourly MACD – The MACD for XRP/USD is now losing pace in the bullish zone.
Hourly RSI (Relative Strength Index) – The RSI for XRP/USD is now above the 50 level.
Major Support Levels – $0.5200 and $0.5150.
Major Resistance Levels – $0.5320 and $0.5450.
What's Your Reaction?


