

XRP Price Stuck In Tiny Trading Range: Consolidation Phase Continues
XRP price is struggling to start a steady increase above $0.50. The price must settle above $0.50 and $0.510 to gain bullish momentum in the near term. XRP price started a minor upward move from the $0.4765 zone. The price is now trading above $0.4850 and the 100-hourly Simple Moving Average. There is a short-term rising channel forming with resistance at $0.500 on the hourly chart of the XRP/USD pair (data source from Kraken). The pair could start a decent increase if it clears the $0.50 and $0.510 resistance levels. XRP Price Consolidates XRP price extended losses below $0.50 like Bitcoin before the bulls appeared. The price tested the $0.4765 level and recently started a recovery wave. A low was formed at $0.4765 and the price climbed within a range. There was a move above the $0.4800 and $0.4850 resistance levels. The bulls pushed the price above the 50% Fib retracement level of the recent decline from the $0.5105 swing high to the $0.4765 low. The price is now trading above $0.4850 and the 100-hourly Simple Moving Average. However, the price seems to be facing hurdles near the $0.4980 and $0.50 levels. There is also a short-term rising channel forming with resistance at $0.500 on the hourly chart of the XRP/USD pair. The resistance coincides with the 61.8% Fib retracement level of the recent decline from the $0.5105 swing high to the $0.4765 low. A clear move above the $0.50 resistance might send the price toward the $0.510 resistance. The next major resistance is near the $0.520 level. A close above the $0.520 resistance zone could send the price higher. The next key resistance is near $0.5320. If the bulls push the price above the $0.5320 resistance level, there could be a steady increase toward the $0.550 resistance. Any more gains might send the price toward the $0.5650 resistance. Another Decline? If XRP fails to clear the $0.50 resistance zone, it could start another decline. Initial support on the downside is near the $0.490 level and the channel zone. The next major support is at $0.4840. If there is a downside break and a close below the $0.4840 level, the price might gain bearish momentum. In the stated case, the price could even trade below the $0.4765 low in the near term. Technical Indicators Hourly MACD – The MACD for XRP/USD is now losing pace in the bullish zone. Hourly RSI (Relative Strength Index) – The RSI for XRP/USD is now below the 50 level. Major Support Levels – $0.4840 and $0.4765. Major Resistance Levels – $0.500 and $0.510.

XRP price is struggling to start a steady increase above $0.50. The price must settle above $0.50 and $0.510 to gain bullish momentum in the near term.
- XRP price started a minor upward move from the $0.4765 zone.
- The price is now trading above $0.4850 and the 100-hourly Simple Moving Average.
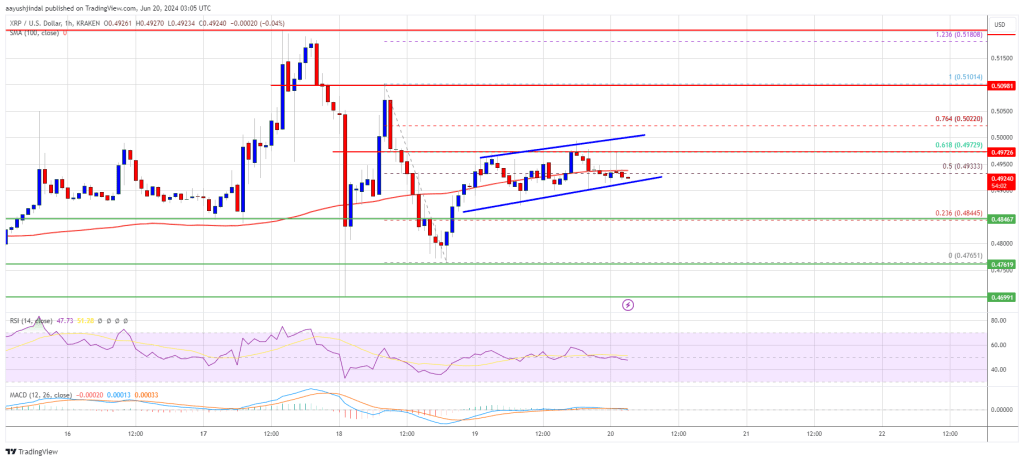
- There is a short-term rising channel forming with resistance at $0.500 on the hourly chart of the XRP/USD pair (data source from Kraken).
- The pair could start a decent increase if it clears the $0.50 and $0.510 resistance levels.
XRP Price Consolidates
XRP price extended losses below $0.50 like Bitcoin before the bulls appeared. The price tested the $0.4765 level and recently started a recovery wave. A low was formed at $0.4765 and the price climbed within a range.
There was a move above the $0.4800 and $0.4850 resistance levels. The bulls pushed the price above the 50% Fib retracement level of the recent decline from the $0.5105 swing high to the $0.4765 low. The price is now trading above $0.4850 and the 100-hourly Simple Moving Average.
However, the price seems to be facing hurdles near the $0.4980 and $0.50 levels. There is also a short-term rising channel forming with resistance at $0.500 on the hourly chart of the XRP/USD pair. The resistance coincides with the 61.8% Fib retracement level of the recent decline from the $0.5105 swing high to the $0.4765 low.
A clear move above the $0.50 resistance might send the price toward the $0.510 resistance. The next major resistance is near the $0.520 level. A close above the $0.520 resistance zone could send the price higher. The next key resistance is near $0.5320.
If the bulls push the price above the $0.5320 resistance level, there could be a steady increase toward the $0.550 resistance. Any more gains might send the price toward the $0.5650 resistance.
Another Decline?
If XRP fails to clear the $0.50 resistance zone, it could start another decline. Initial support on the downside is near the $0.490 level and the channel zone.
The next major support is at $0.4840. If there is a downside break and a close below the $0.4840 level, the price might gain bearish momentum. In the stated case, the price could even trade below the $0.4765 low in the near term.
Technical Indicators
Hourly MACD – The MACD for XRP/USD is now losing pace in the bullish zone.
Hourly RSI (Relative Strength Index) – The RSI for XRP/USD is now below the 50 level.
Major Support Levels – $0.4840 and $0.4765.
Major Resistance Levels – $0.500 and $0.510.
What's Your Reaction?