Cardano Moves Toward $0.4233, Will ADA Maintain Its Uptrend?
Cardano (ADA) lately has been steadily climbing toward the $0.4233 resistance level. This upward movement which has persisted for a while now is raising curiosity among market participants as to whether the crypto asset can continue to maintain its bullish momentum and break through this significant resistance level. Also, Cardano’s recent price performance has showcased its potential for further growth. As ADA continues to maintain its steady upward trajectory, this article delves into exploring this current price action and analyzes technical indicators to determine if the crypto asset can hold its gains and push beyond the $0.4233 resistance mark or face a pullback and begin the drop again. With a market capitalization of more than $14 billion and a trading volume of more than $304 million as of the time of writing, the price of Cardano is currently down by 1.82%, trading at around $0.4008 in the last 24 hours. ADA’s market cap and trading volume are currently up by 1.73% and 41.13% respectively. Assessing ADA’s Potential To Break Through $0.4233 Currently, on the 4-hour chart, the price of ADA is gradually rising with steady momentum and making a move with strong bullish momentum toward the $0.4233 resistance mark. Furthermore, it is evident that the cryptocurrency asset has broken above the 100-day Simple Moving Average (SMA). The formation of the 4-hour Relative Strength Index (RSI) also suggests a continued steady bullish rise for ADA’s price toward $0.4233 as the signal line of the indicator has been maintaining a constant movement above 50% and is attempting a move into the overbought zone. On the 1-day chart, although the crypto asset price is still trading below the 100-day SMA, it has been on a steady rise toward the $0.4233 resistance mark. If this upward momentum persists, Cardano could reach this mark and break through it. Lastly, an analytical examination of the formation of the 1-day RSI reveals that Cardano could sustain its bullish momentum and attain the $0.4233 mark as the signal line of the indicator has risen above 50%. Can Cardano Sustain Its Momentum? If Cardano can maintain its current bullish momentum to reach the $0.4233 mark and close above, it may continue to move upward to test the $0.5229 resistance level. When this level is breached, the digital asset may experience further price gain toward the $0.6822 resistance level and possibly other levels above. Conversely, If ADA’s price faces a pullback at $0.4233, it will start to decline once more, heading back toward the $0.3389 support level. Furthermore, Cardano may see further price decline to test the $0.2388 support level and perhaps other levels below if this $0.3389 point is broken. Featured image from Adobe Stock, chart from Tradingview.com

Cardano (ADA) lately has been steadily climbing toward the $0.4233 resistance level. This upward movement which has persisted for a while now is raising curiosity among market participants as to whether the crypto asset can continue to maintain its bullish momentum and break through this significant resistance level.
Also, Cardano’s recent price performance has showcased its potential for further growth. As ADA continues to maintain its steady upward trajectory, this article delves into exploring this current price action and analyzes technical indicators to determine if the crypto asset can hold its gains and push beyond the $0.4233 resistance mark or face a pullback and begin the drop again.
With a market capitalization of more than $14 billion and a trading volume of more than $304 million as of the time of writing, the price of Cardano is currently down by 1.82%, trading at around $0.4008 in the last 24 hours. ADA’s market cap and trading volume are currently up by 1.73% and 41.13% respectively.
Assessing ADA’s Potential To Break Through $0.4233
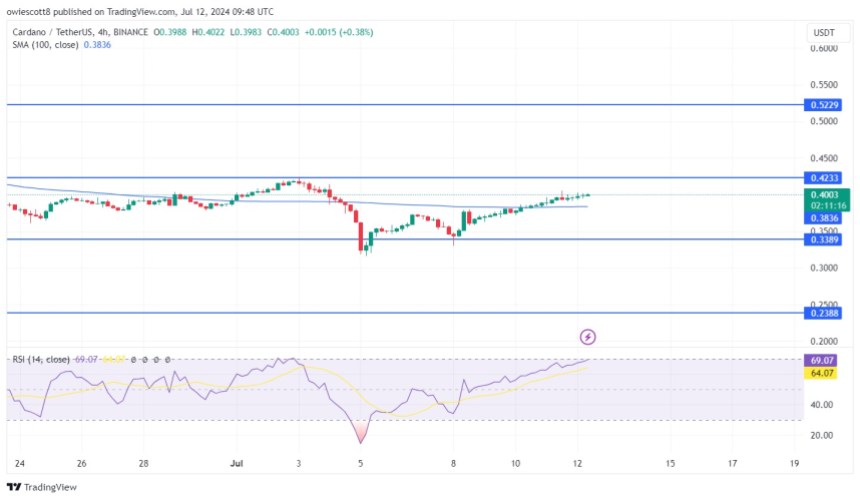
Currently, on the 4-hour chart, the price of ADA is gradually rising with steady momentum and making a move with strong bullish momentum toward the $0.4233 resistance mark. Furthermore, it is evident that the cryptocurrency asset has broken above the 100-day Simple Moving Average (SMA).

The formation of the 4-hour Relative Strength Index (RSI) also suggests a continued steady bullish rise for ADA’s price toward $0.4233 as the signal line of the indicator has been maintaining a constant movement above 50% and is attempting a move into the overbought zone.
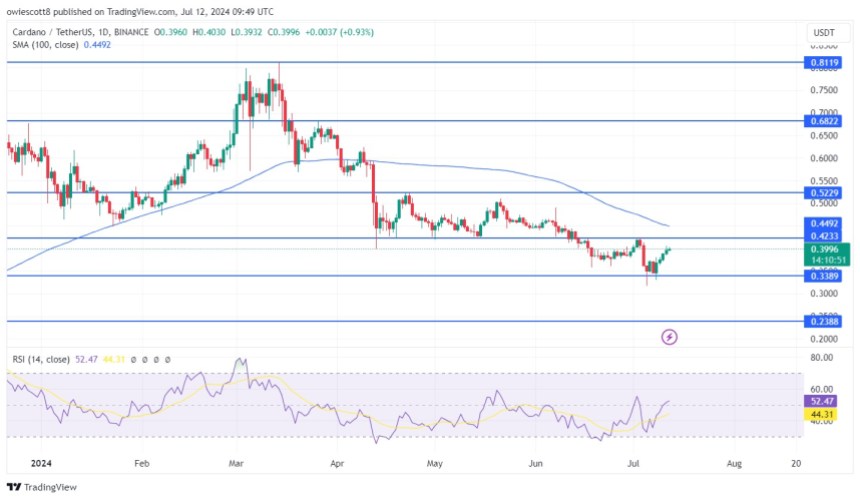
On the 1-day chart, although the crypto asset price is still trading below the 100-day SMA, it has been on a steady rise toward the $0.4233 resistance mark. If this upward momentum persists, Cardano could reach this mark and break through it.

Lastly, an analytical examination of the formation of the 1-day RSI reveals that Cardano could sustain its bullish momentum and attain the $0.4233 mark as the signal line of the indicator has risen above 50%.
Can Cardano Sustain Its Momentum?
If Cardano can maintain its current bullish momentum to reach the $0.4233 mark and close above, it may continue to move upward to test the $0.5229 resistance level. When this level is breached, the digital asset may experience further price gain toward the $0.6822 resistance level and possibly other levels above.
Conversely, If ADA’s price faces a pullback at $0.4233, it will start to decline once more, heading back toward the $0.3389 support level. Furthermore, Cardano may see further price decline to test the $0.2388 support level and perhaps other levels below if this $0.3389 point is broken.
What's Your Reaction?


