Dogecoin Price (DOGE) Set For Fresh Gains: Can It Surge Higher?
Dogecoin started a fresh increase above the $0.1050 resistance against the US Dollar. DOGE is correcting gains and might find bids near the $0.1032 level. DOGE price is facing hurdles near the $0.1100 pivot zone. The price is trading near the $0.1040 level and the 100-hourly simple moving average. There is a key bullish trend line forming with support near $0.1032 on the hourly chart of the DOGE/USD pair (data source from Kraken). The price could start a fresh increase above the $0.1065 resistance zone. Dogecoin Price Holds Key Support In the past few sessions, Dogecoin price saw a decent increase above $0.100 like Bitcoin and Ethereum. The price was able to clear the $0.1032 and $0.1050 resistance levels. The bulls even pushed it above $0.1080 and the 100-hourly simple moving average. A high was formed at $0.1090 and the price is now correcting gains. The price declined below the $0.1060 level. There was a drop below the 50% Fib retracement level of the upward move from the $0.1000 swing low to the $0.1090 high. Dogecoin is now trading near the $0.1040 level and the 100-hourly simple moving average. Besides, there is a key bullish trend line forming with support near $0.1032 on the hourly chart of the DOGE/USD pair. The trend line is close to the 61.8% Fib retracement level of the upward move from the $0.1000 swing low to the $0.1090 high. Immediate resistance on the upside is near the $0.1065 level. The next major resistance is near the $0.1080 level. A close above the $0.1080 resistance might send the price toward the $0.1100 resistance. Any more gains might send the price toward the $0.1120 level. The next major stop for the bulls might be $0.1150. More Downsides In DOGE? If DOGE’s price fails to recover above the $0.1065 level, it could continue to move down. Initial support on the downside is near the $0.1032 level. The next major support is near the $0.1020 level. The main support sits at $0.1000. If there is a downside break below the $0.1000 support, the price could decline further. In the stated case, the price might decline toward the $0.0900 level or even $0.0880 in the near term. Technical Indicators Hourly MACD – The MACD for DOGE/USD is now losing momentum in the bullish zone. Hourly RSI (Relative Strength Index) – The RSI for DOGE/USD is now below the 50 level. Major Support Levels – $0.1032 and $0.1000. Major Resistance Levels – $0.1065 and $0.1100.

Dogecoin started a fresh increase above the $0.1050 resistance against the US Dollar. DOGE is correcting gains and might find bids near the $0.1032 level.
- DOGE price is facing hurdles near the $0.1100 pivot zone.
- The price is trading near the $0.1040 level and the 100-hourly simple moving average.
- There is a key bullish trend line forming with support near $0.1032 on the hourly chart of the DOGE/USD pair (data source from Kraken).
- The price could start a fresh increase above the $0.1065 resistance zone.
Dogecoin Price Holds Key Support
In the past few sessions, Dogecoin price saw a decent increase above $0.100 like Bitcoin and Ethereum. The price was able to clear the $0.1032 and $0.1050 resistance levels.
The bulls even pushed it above $0.1080 and the 100-hourly simple moving average. A high was formed at $0.1090 and the price is now correcting gains. The price declined below the $0.1060 level. There was a drop below the 50% Fib retracement level of the upward move from the $0.1000 swing low to the $0.1090 high.
Dogecoin is now trading near the $0.1040 level and the 100-hourly simple moving average. Besides, there is a key bullish trend line forming with support near $0.1032 on the hourly chart of the DOGE/USD pair.
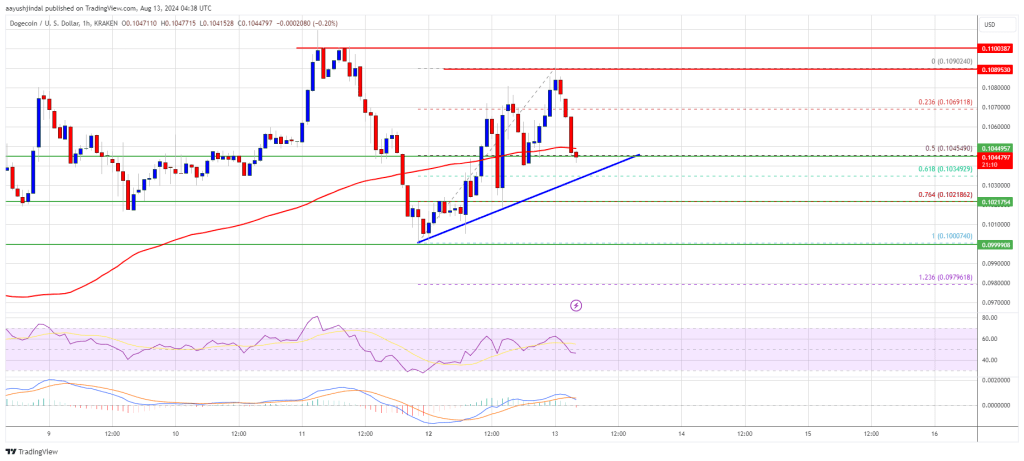
The trend line is close to the 61.8% Fib retracement level of the upward move from the $0.1000 swing low to the $0.1090 high. Immediate resistance on the upside is near the $0.1065 level. The next major resistance is near the $0.1080 level. A close above the $0.1080 resistance might send the price toward the $0.1100 resistance. Any more gains might send the price toward the $0.1120 level. The next major stop for the bulls might be $0.1150.
More Downsides In DOGE?
If DOGE’s price fails to recover above the $0.1065 level, it could continue to move down. Initial support on the downside is near the $0.1032 level. The next major support is near the $0.1020 level.
The main support sits at $0.1000. If there is a downside break below the $0.1000 support, the price could decline further. In the stated case, the price might decline toward the $0.0900 level or even $0.0880 in the near term.
Technical Indicators
Hourly MACD – The MACD for DOGE/USD is now losing momentum in the bullish zone.
Hourly RSI (Relative Strength Index) – The RSI for DOGE/USD is now below the 50 level.
Major Support Levels – $0.1032 and $0.1000.
Major Resistance Levels – $0.1065 and $0.1100.
What's Your Reaction?